

We at XeoMatrix have gathered a few tips & tricks that can make your Tableau development experience even more efficient. Today’s topic is: Right-Click and Drag for Aggregations.
To add aggregations to your visualizations, you can use a simple right-click and drag.
We’ve created an example visualization below to show you to use the right-click and drag for aggregations. To create this visualization, we placed the sub-category field into rows and the discount field into columns.
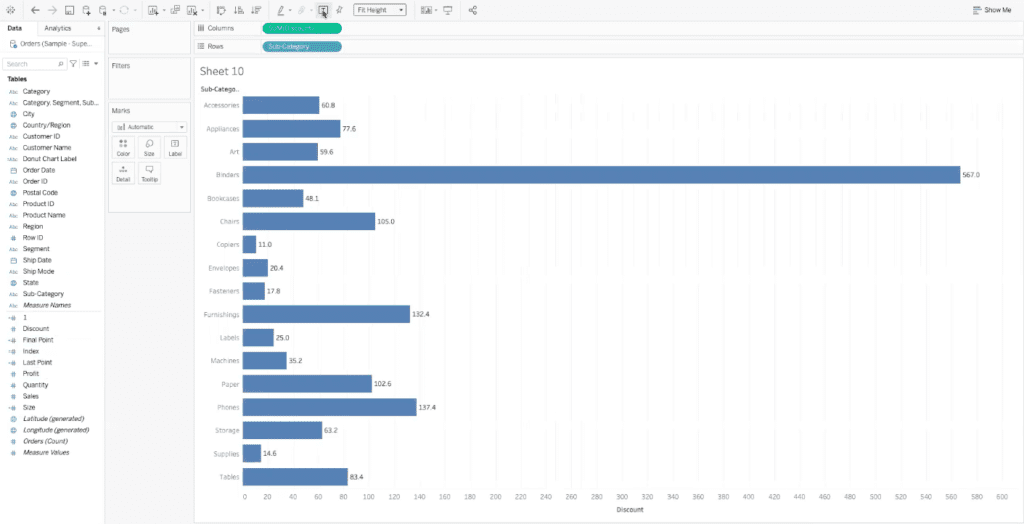
Now, when we add the discount field to the columns section, it automatically changes to read “SUM(discount)”. SUM(discount) is the default setting for the discount field in Tableau, but it’s not the best way to represent the data we’re looking for.
We want our columns to show the average sum measure instead. To fix this, we can go through the SUM(discount) menu and sub-menu, but there’s an easier way: right-click and drag.
First, right-click on the discount field in the tables menu in your Tableau worksheet.
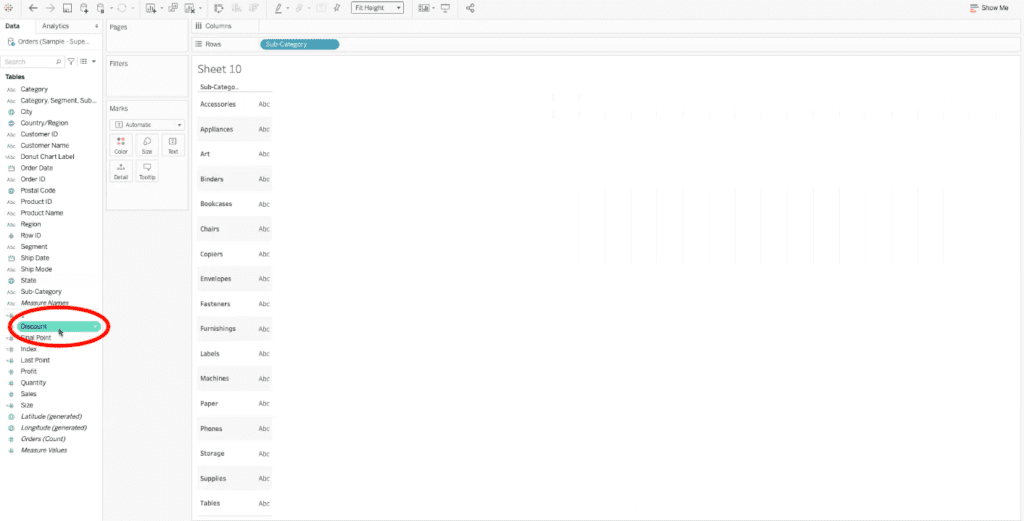
Once the discount field is highlighted, as shown above, continue holding down the right-click and drag it up to the columns bar. After you have dragged the discount field to the column bar, let go of the right-click. A menu will appear, as shown below.
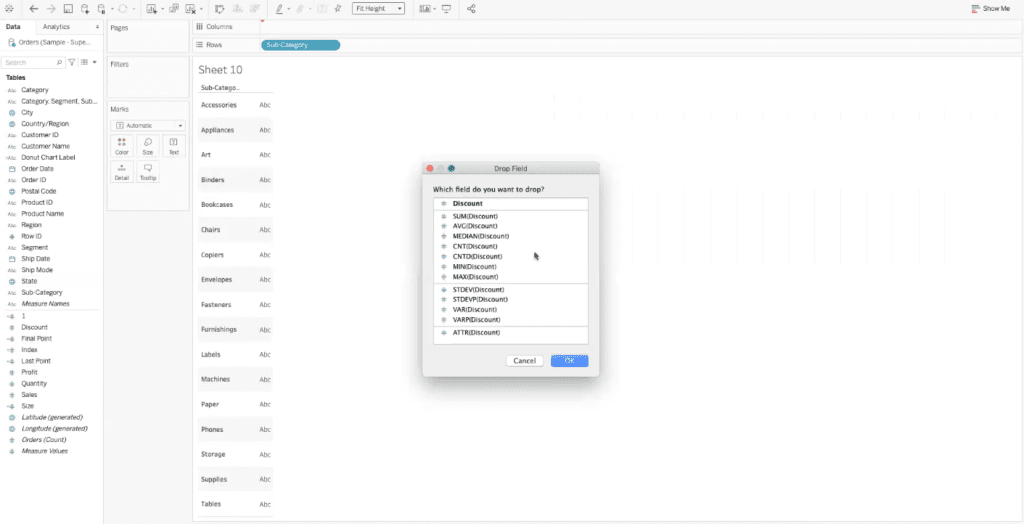
In this menu, select AVG(discount). Tableau will automatically aggregate the data into the average discount based on sub-categories, as shown below.
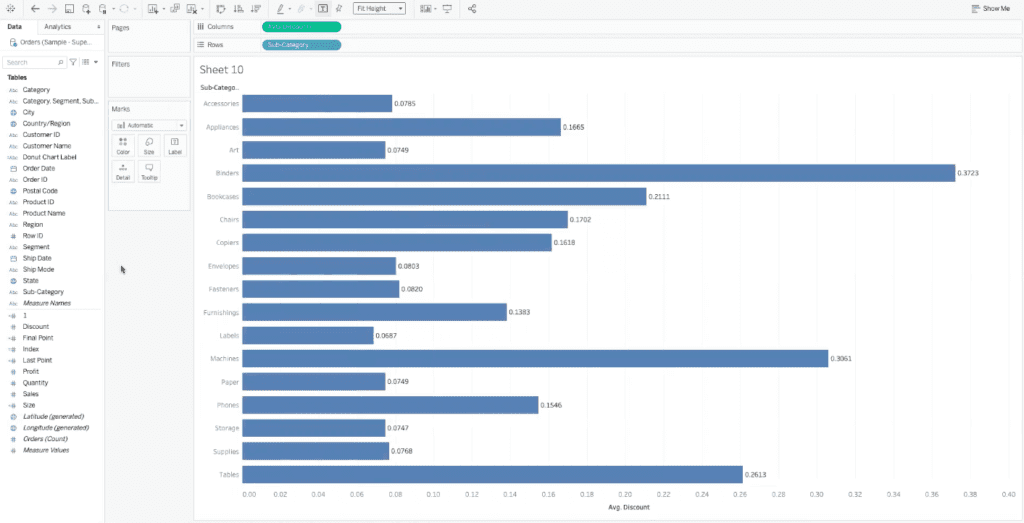
Now you have successfully visualized aggregated data with a right-click and drag. This method works well with measure values or dates.
Get Tableau Help
These four tricks within Tableau can simplify tasks and save you time as you build out your data visualizations. If you are having trouble with your Tableau dashboards and need your data to better work for your business, our team of Tableau experts is here to help. XeoMatrix offers Tableau training, Tableau dashboard design, and data warehousing assistance. Contact us today to learn more about our business intelligence solutions.