As organizations move into 2026, understanding digital behavior is more important than ever. Whether you’re optimizing marketing efforts, reporting on engagement, or tracking performance across teams, Google Analytics dashboards built in Tableau offer unmatched clarity and flexibility. These dashboards turn complex web activity into intuitive, interactive stories, empowering leaders to monitor KPIs, identify patterns, and make smarter, faster decisions.
In this blog post, we highlight five Tableau dashboards built using Google Analytics data, each showcasing a unique approach to analyzing user behavior and website performance. These dashboards demonstrate how effective design, clear visual storytelling, and interactive analysis can help businesses make smarter decisions in 2026 and beyond.
Tableau Google Analytics Dashboard 1: Google Analytics Dashboard by XeoMatrix
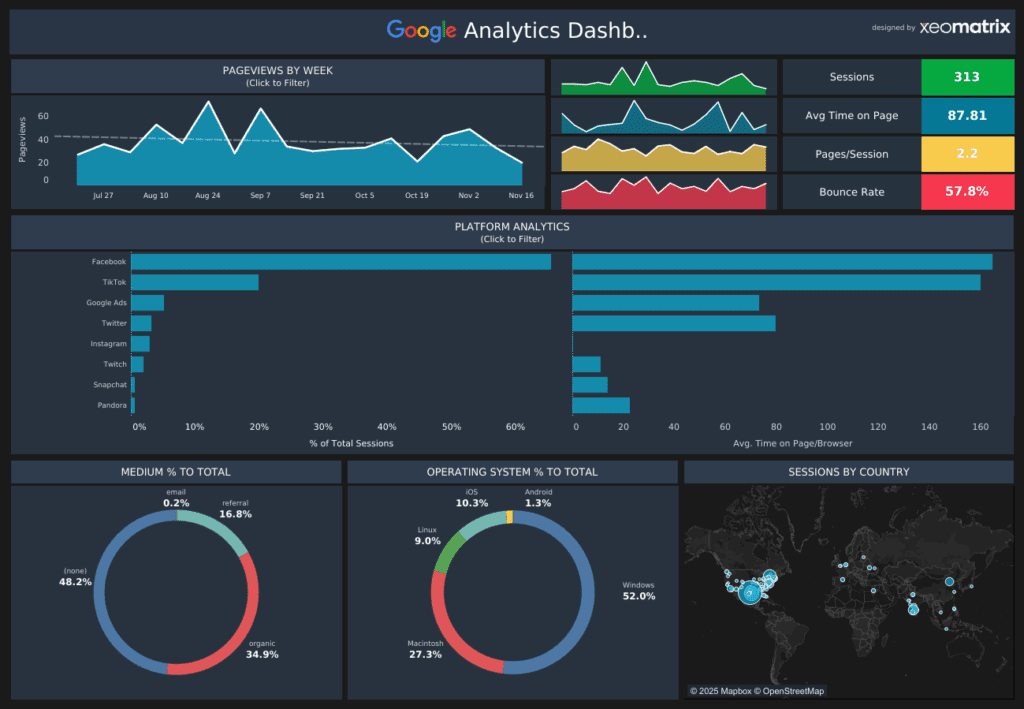
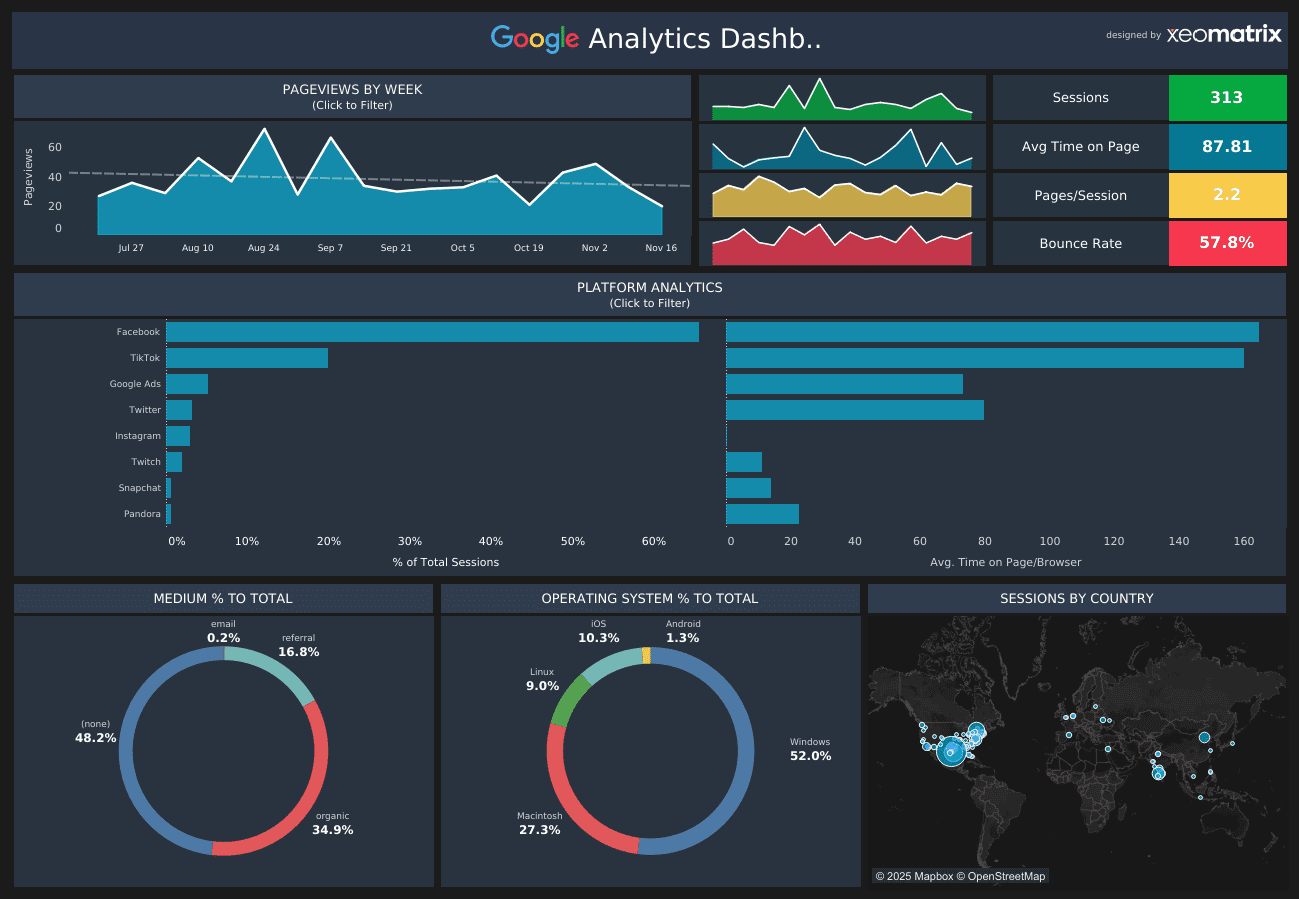
The Google Analytics Dashboard by XeoMatrix provides a clean snapshot of core Google Analytics KPIs, including sessions, average time on page, pages per session, and bounce rate. Supporting visuals highlight pageviews by week, medium contribution, operating system usage, and platform analytics, including Facebook, Instagram, TikTok, and more. A sessions-by-country map helps teams quickly identify geographic engagement patterns, while a time-on-page-per-browser chart uncovers how browser type affects performance. With filters layered throughout, users can view trends over time or drill into specific traffic sources.
This dashboard works well because it brings together critical performance insights in a concise, highly readable layout. Each chart focuses on a specific aspect of website engagement, making it easy to spot what’s driving quality sessions and where users may be dropping off. The ability to compare engagement across operating systems and platforms provides valuable context for technical optimization and campaign planning. This is an ideal executive-ready dashboard, simple enough for quick reviews yet detailed enough for deeper analysis.
Interact and download the Google Analytics Dashboard in Tableau Public.
Tableau Google Analytics Dashboard 2: Google Analytics Home Dashboard
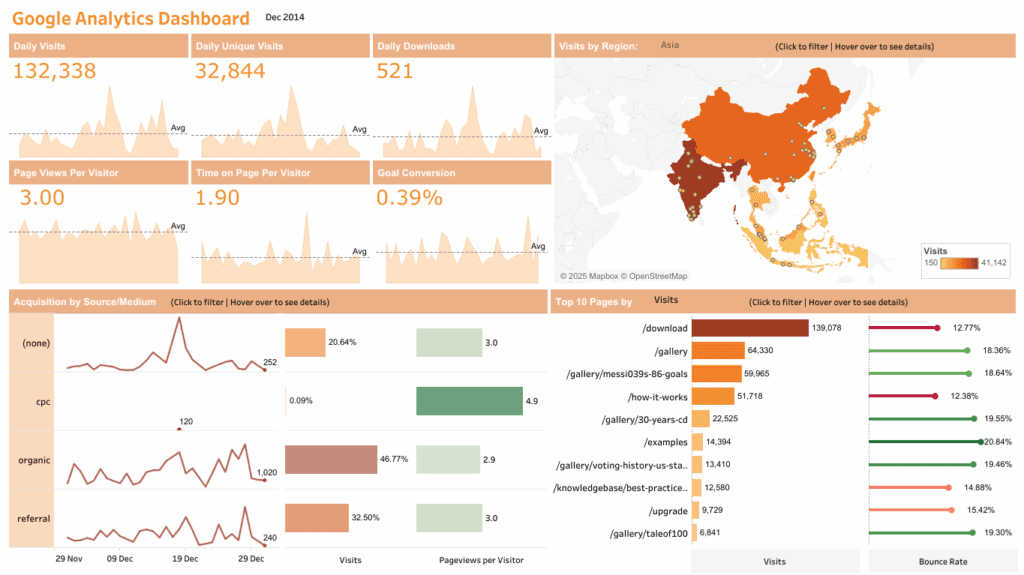
The Google Analytics Home Dashboard offers a comprehensive overview of large-scale website performance. It highlights average daily visits, unique visits, downloads, page views per visitor, time on page, and conversion rate. A detailed regional map allows users to filter activity by geography, while the Acquisition by Source/Medium visualization compares performance across organic, paid, referral, and direct channels. A Top 10 Pages section surfaces the most-visited content, complete with visit counts, pageview totals, and bounce rate insights.
This dashboard works well because it integrates high-level KPIs with deeper contextual metrics that highlight content performance and traffic quality. The map component makes geographic filtering seamless, while the acquisition and page-level insights provide multiple entry points for analysis. Whether assessing engagement, optimizing campaigns, or reviewing content strategy, this dashboard gives stakeholders a clear and intuitive view of what’s resonating with their audience, and what isn’t.
Interact and download the Google Analytics Home Dashboard in Tableau Public.
Tableau Google Analytics Dashboard 3: Google Analytics Dashboard by Chi
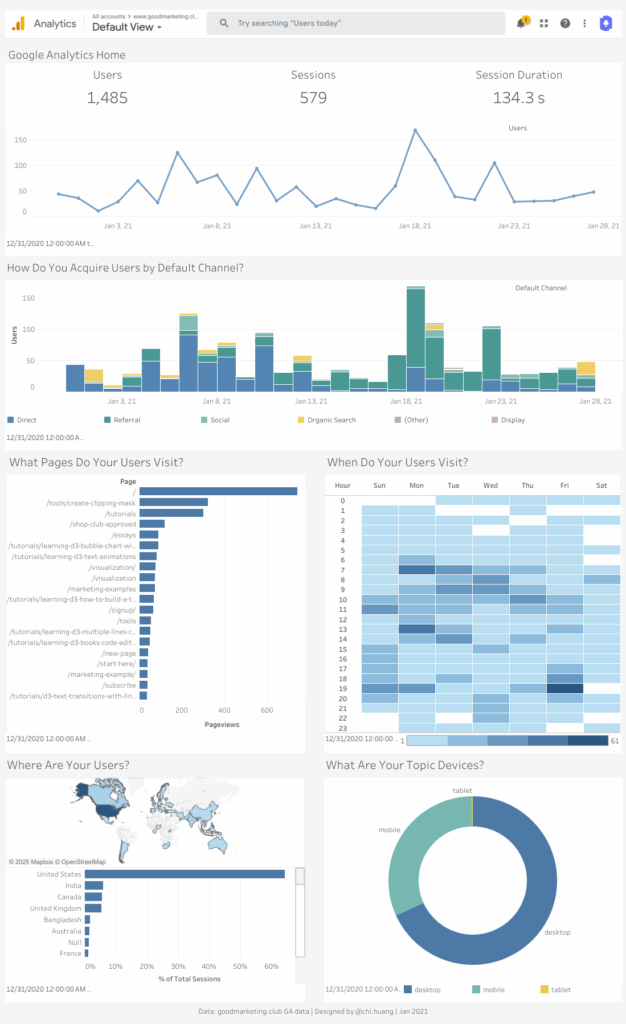
The Google Analytics Dashboard by Chi offers a dynamic overview of daily activity, displaying user counts, session volumes, and average session duration. Trend lines reveal fluctuations in users over time, while acquisition charts break down traffic by default channel groups such as Direct, Referral, Social, and Organic Search. A geographic distribution chart highlights the countries driving the highest share of sessions, and a detailed pageviews list shows exactly which pages users are visiting most. The dashboard also includes device insights, separating desktop, mobile, and tablet traffic for a well-rounded look at audience behavior.
This dashboard works well because it mirrors the familiar Google Analytics experience while enhancing it with Tableau’s interactivity and clarity. The combination of time-series analysis, traffic acquisition breakdowns, and device usage makes it easy to understand how users find and engage with the website. The layout ensures every essential metric is at your fingertips, enabling teams to monitor performance, identify meaningful spikes or dips, and adjust content or campaigns accordingly.
Interact and download the Google Analytics Dashboard in Tableau Public.
Tableau Google Analytics Dashboard 4: Colibrí Google Analytics Tableau Dashboard
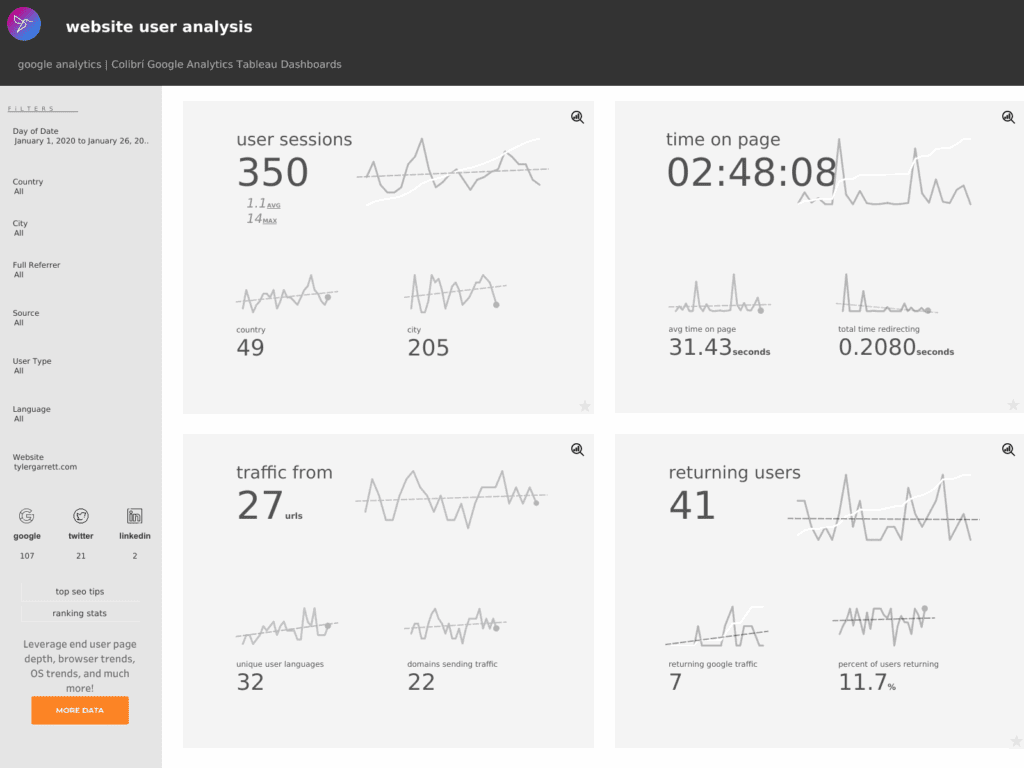
The Colibrí Google Analytics Tableau Dashboard provides a detailed breakdown of user sessions, unique user counts, average time on page, returning user behavior, languages, traffic-sending domains, and more. Filters for date, country, city, referrer, source, user type, and language make it easy to analyze engagement at a granular level. A section dedicated to Twitter, Google, LinkedIn, and SEO data helps illuminate top-performing inbound channels. Summary metrics, such as total time on page, percent returning users, and number of traffic sources, round out this highly interactive dashboard.
This dashboard works well because it gives teams a powerful and flexible way to evaluate the quality of their audience engagement. The visual spotlight on user behavior, including page depth, browser and OS trends, and inbound referral patterns, makes it a strong tool for content strategy and UX optimization. With its comprehensive filters and detailed traffic insights, this dashboard empowers teams to uncover patterns that would otherwise remain hidden, making it an excellent model for deep-dive user analysis in 2026.
Interact and download the Colibrí Google Analytics Tableau Dashboards in Tableau Public.
Tableau Google Analytics Dashboard 5: Digital Marketing Dashboard
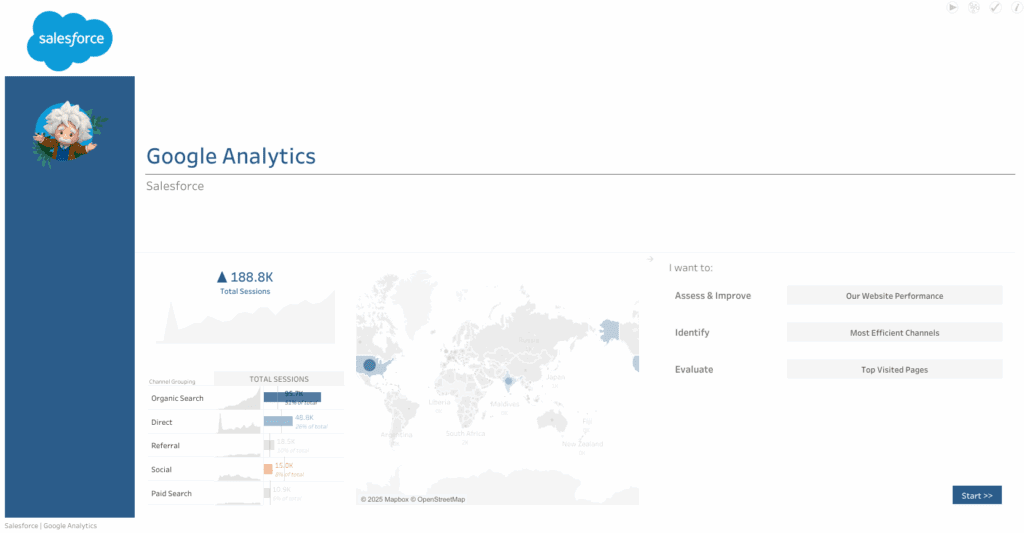
The Digital Marketing Dashboard blends traffic analytics with business-oriented performance metrics, making it ideal for organizations that rely heavily on both marketing and sales data. It showcases total sessions and channel grouping performance, highlighting Organic Search, Direct, Referral, Paid Search, and Social traffic. The world map component reveals where traffic originates, allowing teams to evaluate engagement geographically and tie insights back to Salesforce data. Each channel’s total sessions and percentage of overall traffic offer a clear view of acquisition efficiency.
This dashboard works well because it bridges the gap between marketing performance and revenue-focused business strategy. By pairing Google Analytics traffic with Salesforce-aligned metrics, users gain clarity into which channels generate meaningful engagement. The intuitive layout makes comparisons across channels simple, enabling organizations to quickly identify opportunities to scale high-performing sources or improve underperforming ones. For businesses looking to unify marketing and sales analytics, this dashboard is a strong example of cross-platform reporting done right.
Interact and download the Digital Marketing Dashboard in Tableau Public.
Transform Your Analytics Strategy with Tableau and XeoMatrix
Google Analytics data is powerful, but when paired with Tableau, it becomes transformational. Tableau enables organizations to explore their data interactively, visualize trends clearly, and unlock insights that directly impact growth, user engagement, and digital strategy.
At XeoMatrix, we help organizations modernize their analytics capabilities with expertly designed dashboards, intuitive reporting, and scalable data infrastructure. From optimizing website performance to unifying multi-platform analytics and building executive-ready reporting, our team ensures you get the most from your analytics ecosystem.
About XeoMatrix
XeoMatrix is a trusted leader in data and analytics consulting, helping businesses transform complex data into actionable insights. Our proven methodologies ensure a streamlined approach to data visualization, reporting, and business intelligence, allowing companies to focus on analyzing trends, making informed decisions, and maximizing ROI. Learn more about our Tableau dashboard development solutions—reach out to us today!