Tableau sets are one of the most versatile tools for performing data comparisons, creating dynamic highlights, and focusing attention on key subsets of your data. By grouping related data points based on specific conditions or selections, sets make it easier to analyze trends, identify outliers, and design interactive dashboards.
In this guide, we’ll explore how to create and use sets in Tableau, from simple manual selections to dynamic, parameter-driven conditions, so you can enhance the analytical power of your visualizations.
Tutorial Video
Step-by-Step Guide to Creating Sets in Tableau
Sets in Tableau can be created in multiple ways, depending on how you want to define the grouping of your data.
1. Creating a Set from a Selection in Tableau
You can create a set directly from your view by selecting marks on a visualization.
Start by holding Shift and selecting several marks on your chart.
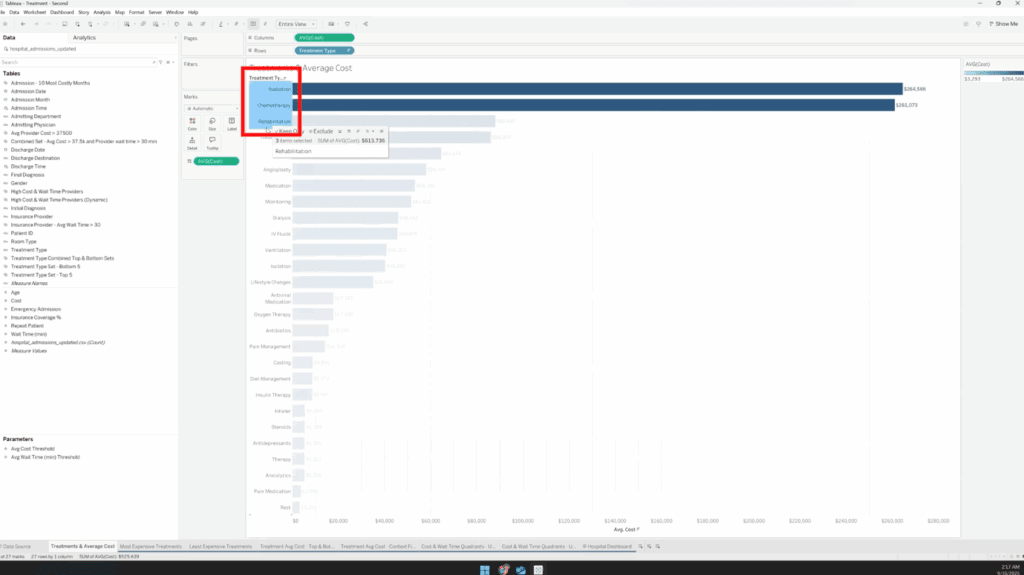
Then, right-click on one of the selected marks and choose Create Set from the pop-up menu.
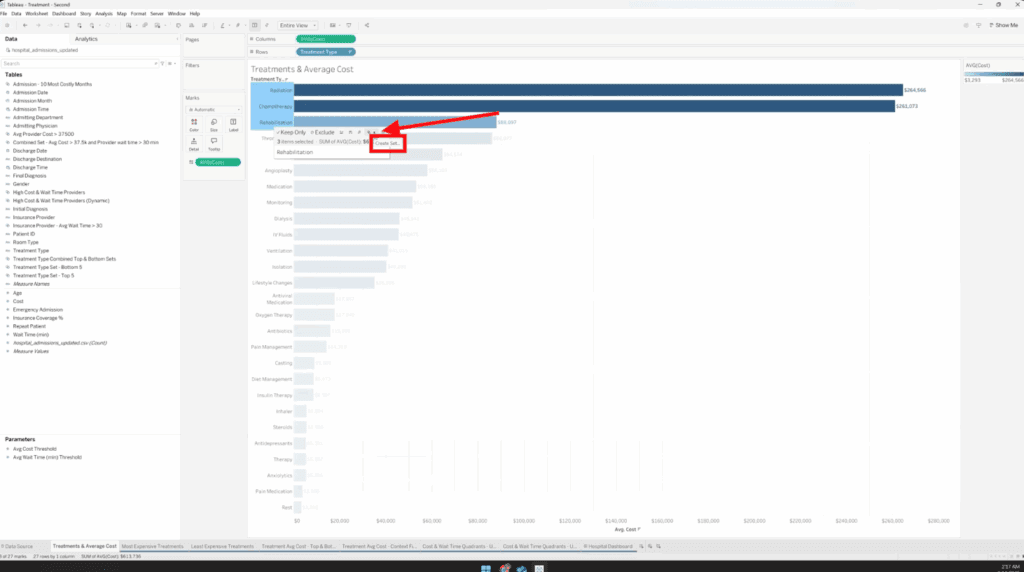
Tableau will generate a new set, indicated by the double-ring icon in your Data Pane. Give your set a descriptive name and click OK.
This method is quick and intuitive—perfect for highlighting specific points such as the months with the highest costs or the top-performing categories.
2. Creating a Set from the Data Pane in Tableau
For a more structured approach, you can build a set from a dimension in your data source.
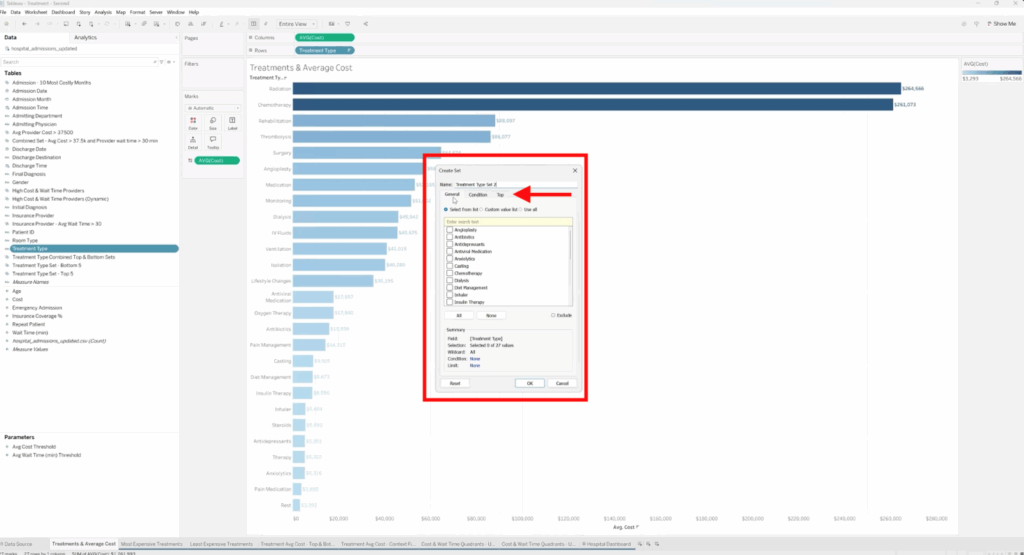
In the Data Pane, right-click a dimension from your Y-axis (e.g., Treatment Type) and select Create > Set.
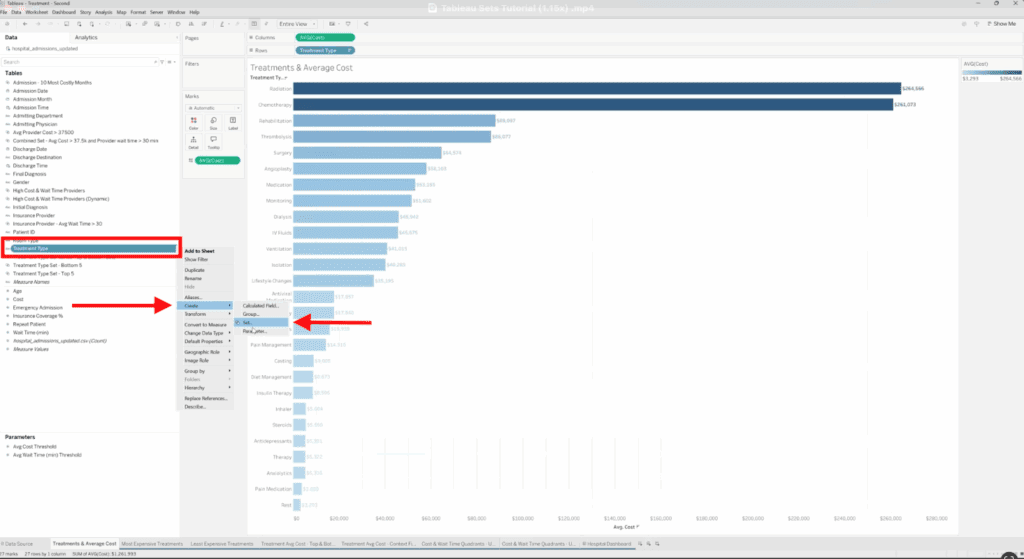
In the Create Set dialog box, you’ll find three tabs: General, Condition, and Top.
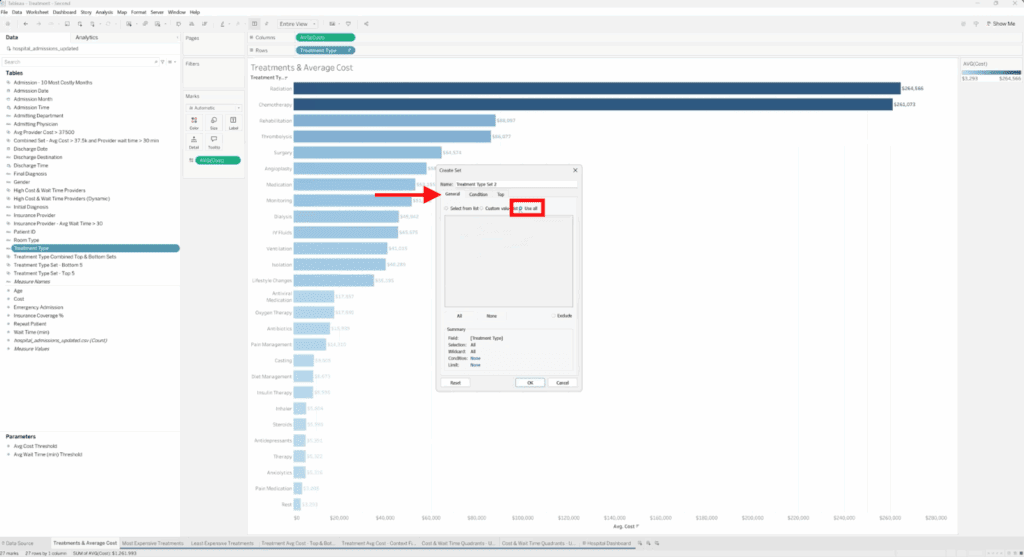
If you want Tableau to automatically update the set when new data becomes available, under the General Tab, select ‘Use All’.
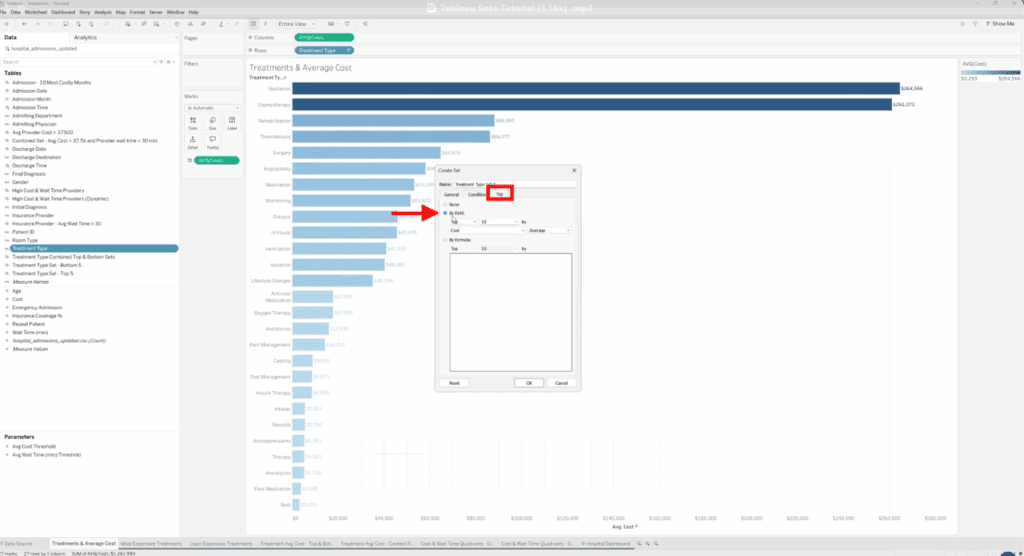
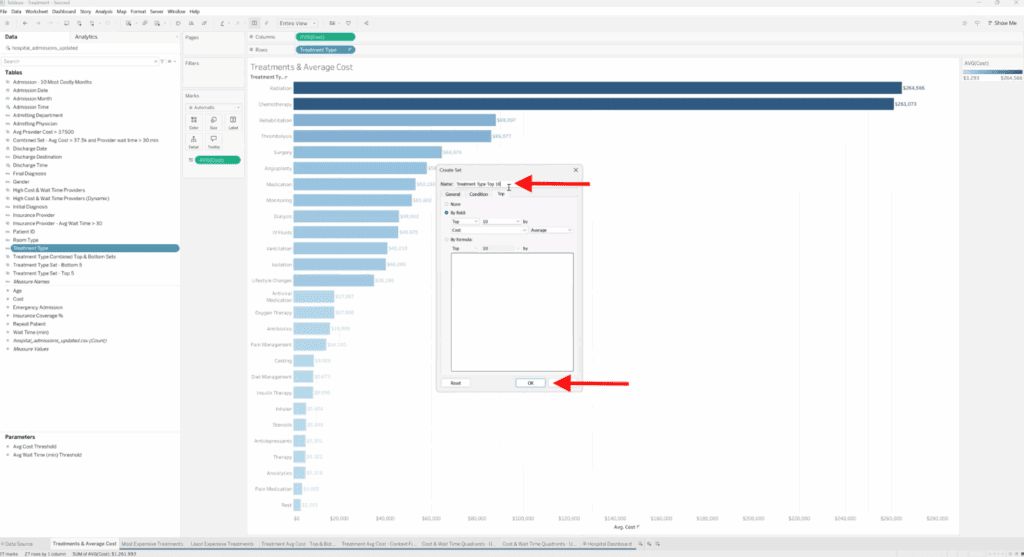
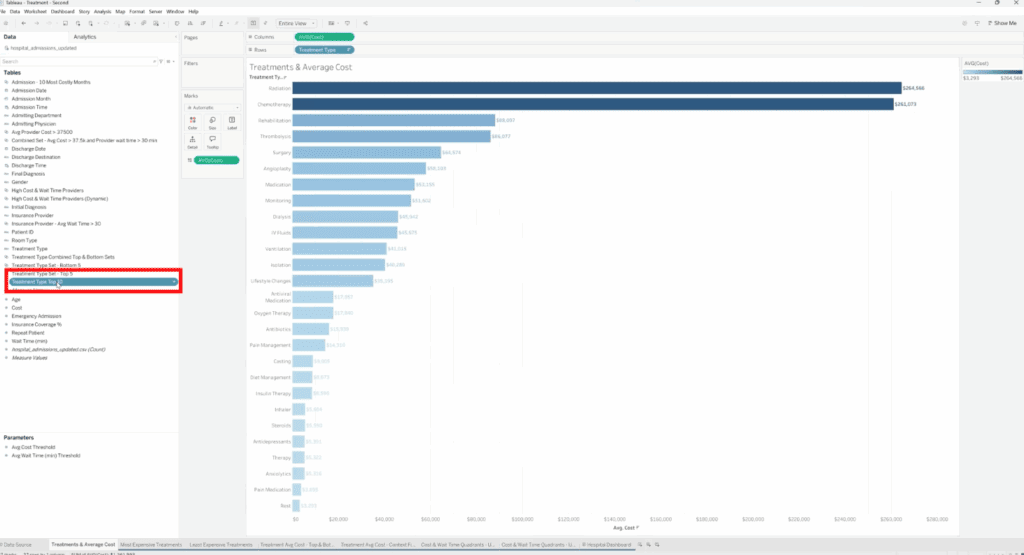
Under the Top tab, you can choose to include the top or bottom items by a specific measure, such as the top 10 treatments by average cost.
Name your new set (e.g., Top 10 Treatments) and click OK.
This asset has been added as a reusable asset in the data pane.
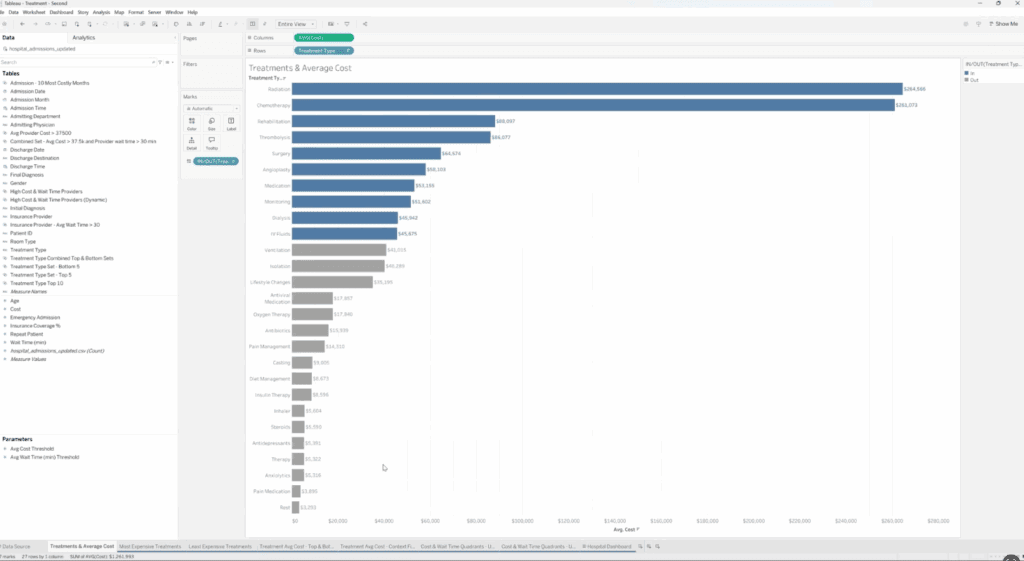
This new set can then be applied to color, filters, or other marks in your visualization. To apply color, drag it from the pane into the Color section.
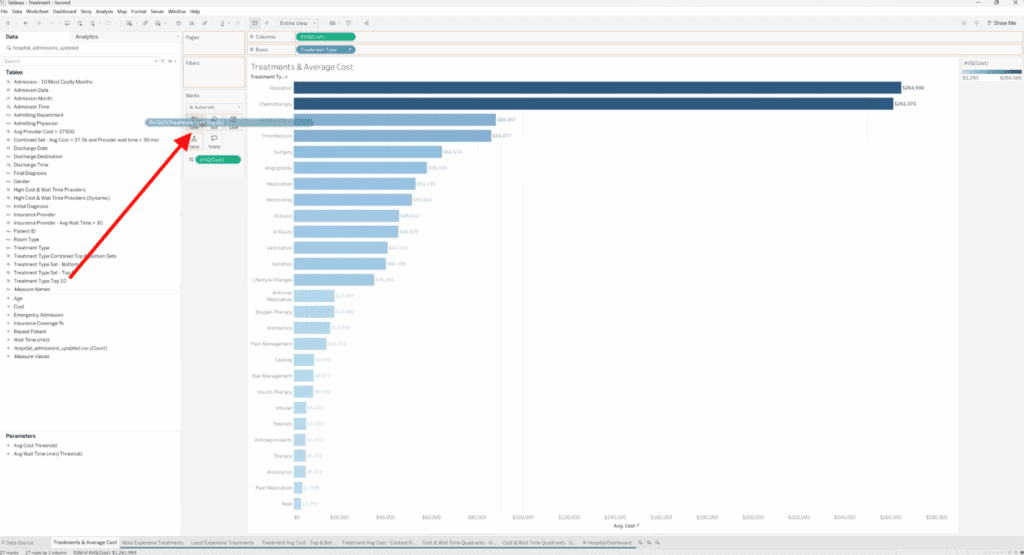
Tableau will dynamically classify data as “In” or “Out” based on the rules you defined.
3. Combining Sets in Tableau
When analyzing data, you may want to compare multiple sets, such as the Top 5 and Bottom 5 performers, and view them together.
In the Data Pane, select both sets you want to combine.
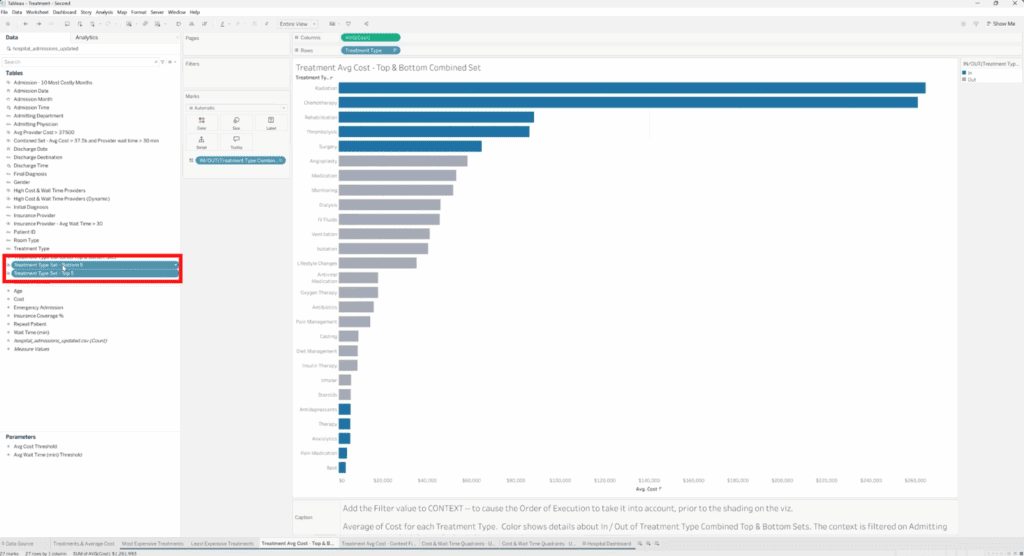
Right-click and choose Create Combined Set.
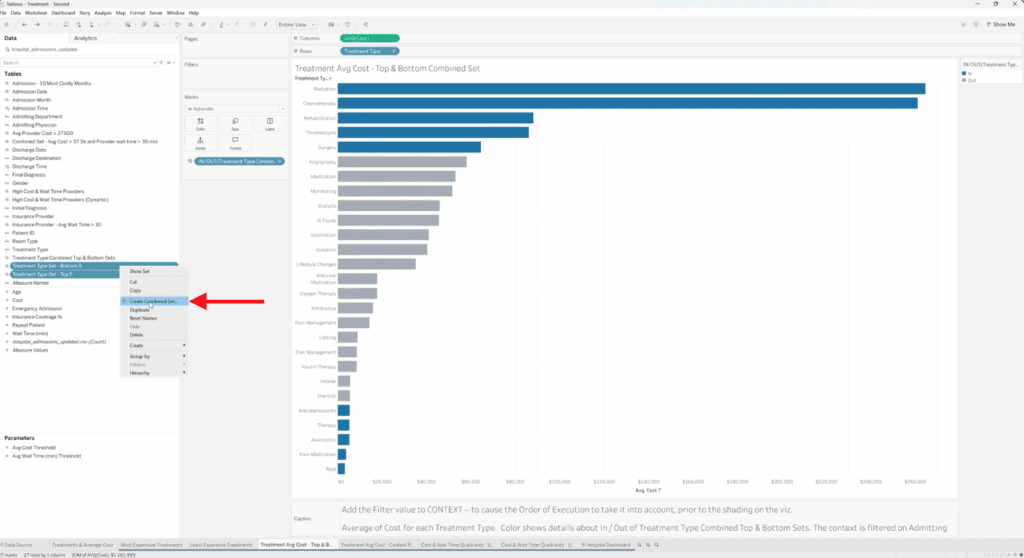
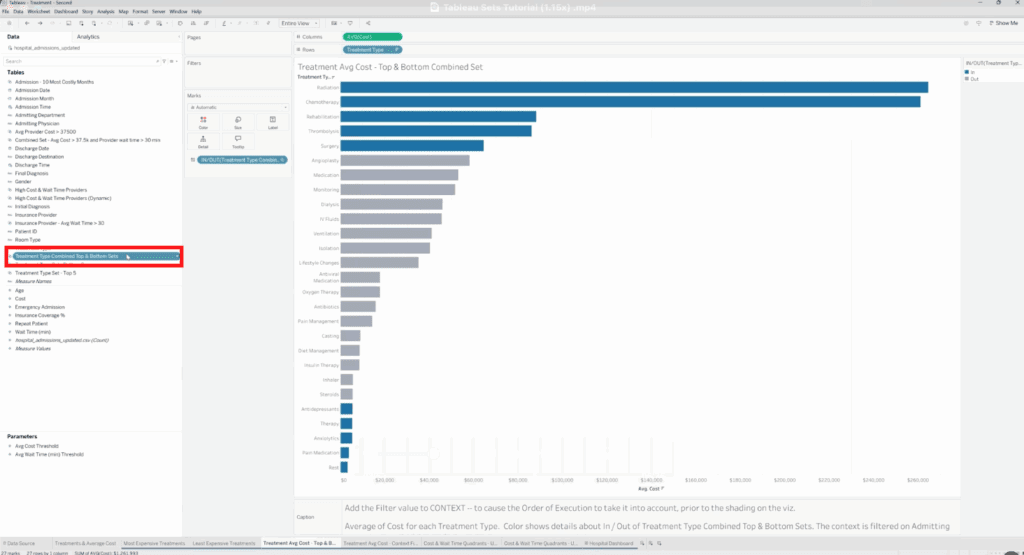
This action will create a new dataset in our Data Pane.
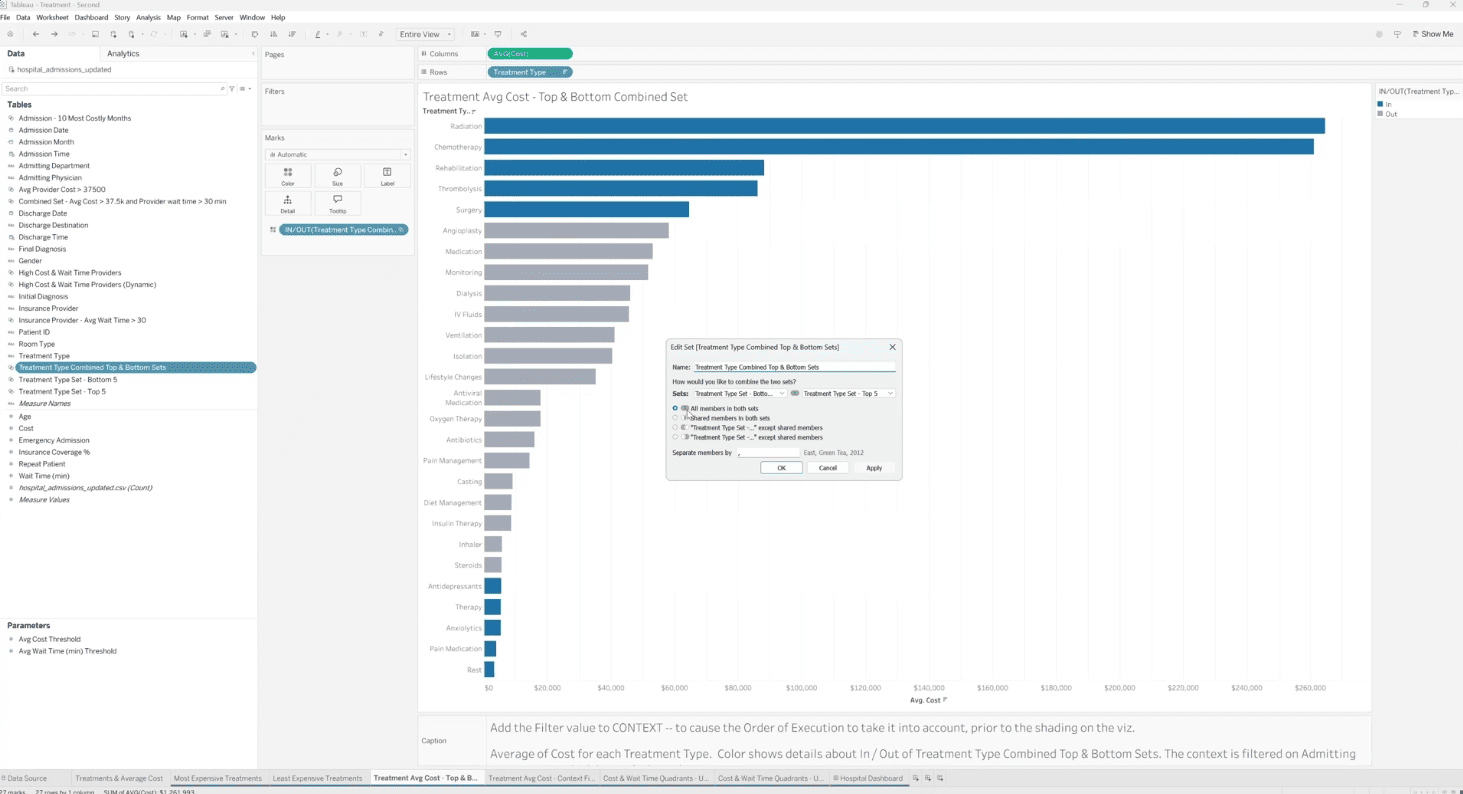
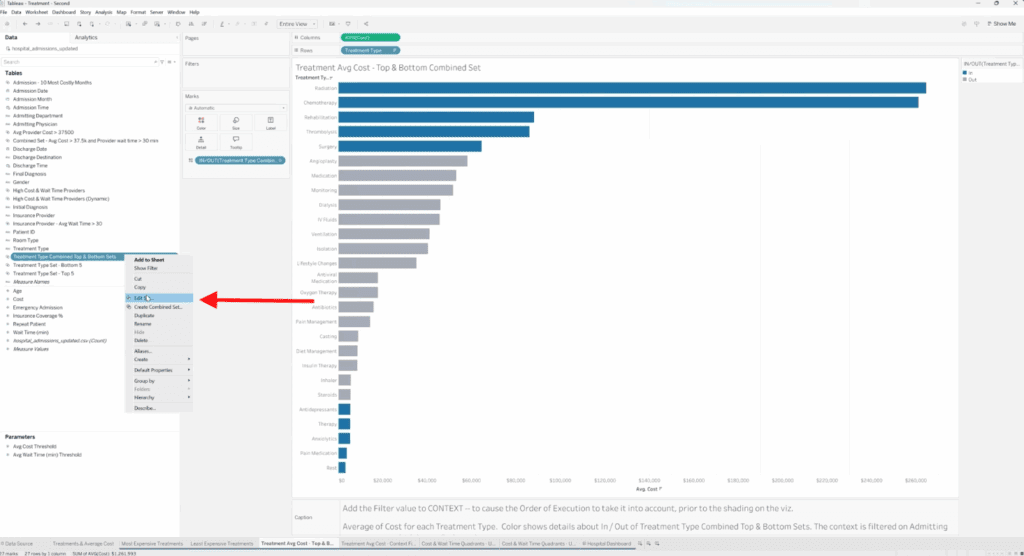
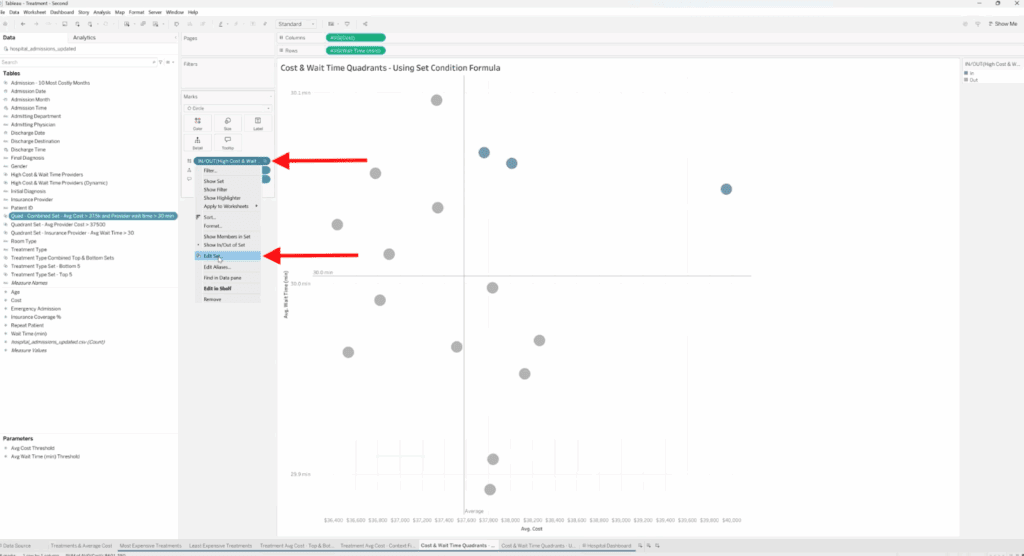
To edit the new Combined Set, right-click on this treatment and select Edit Set.
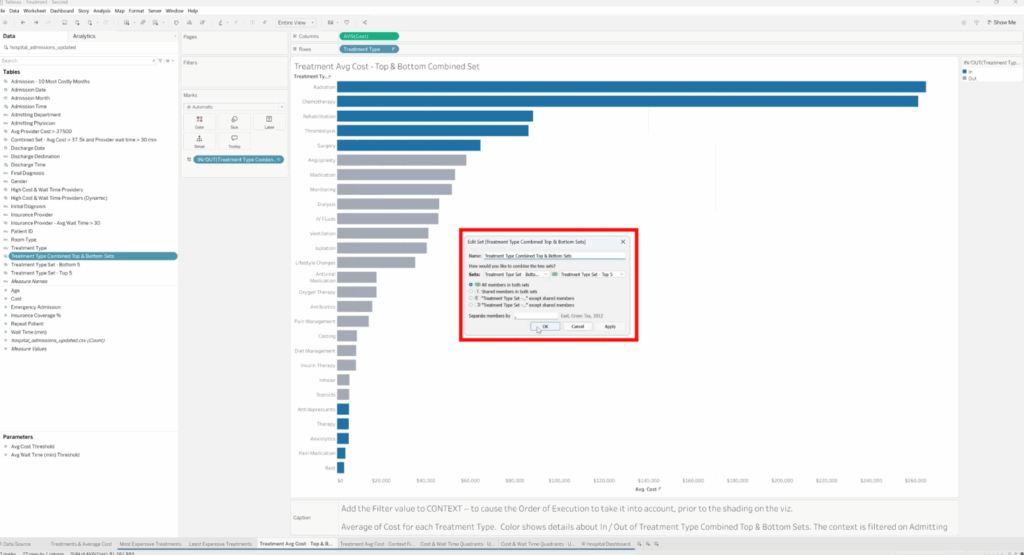
In the Edit Set box, you now have the opportunity to provide more details on how you want these sets to be accounted for. That would depend on the data that you’re using. You have several other options, including the ability to discuss a separator with Tableau. The combined set can be used to highlight both high and low performers simultaneously within a single visualization, making it ideal for identifying outliers or boundary cases. For example, you can work with intersecting data or for your outer edges.
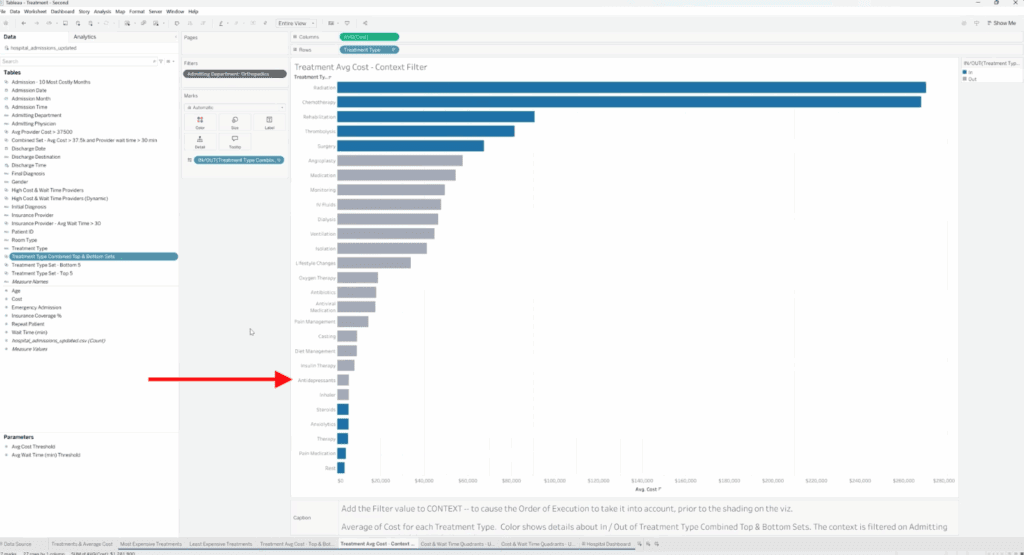
4. Adjusting Sets with Context Filters in Tableau
When filters are applied to your dashboard, they may change the data being analyzed, which affects how sets are calculated. To ensure sets respect specific filters (like department or category), you can add filters to Context.
Right-click the filter in your Filters Shelf and choose Add to Context.
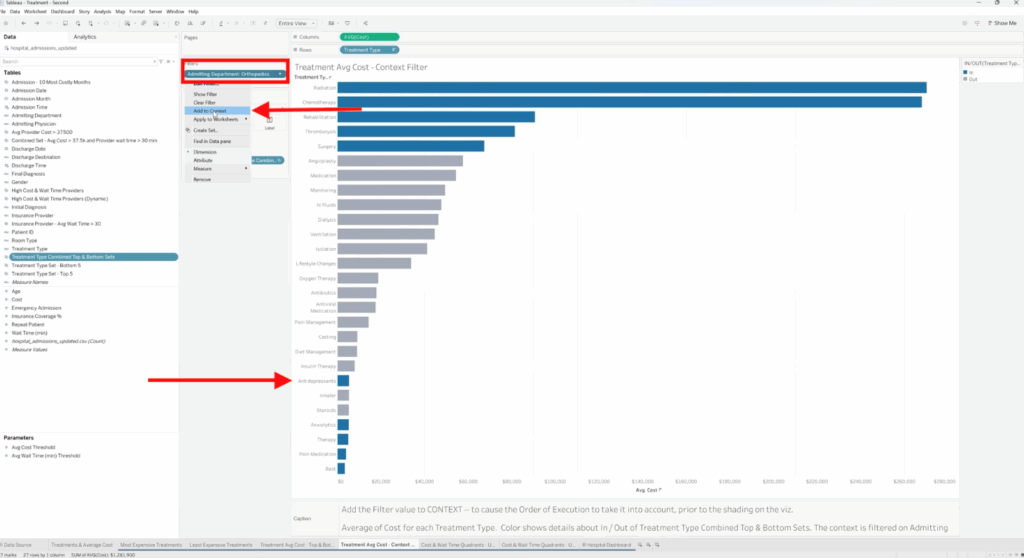
This ensures that Tableau applies the context filter first before recalculating which data points belong to your set.
5. Creating Dynamic Sets with Parameters
Sets can also be made interactive using parameters. Instead of hardcoding values (such as a fixed top 10), create a parameter that allows users to control the threshold dynamically.
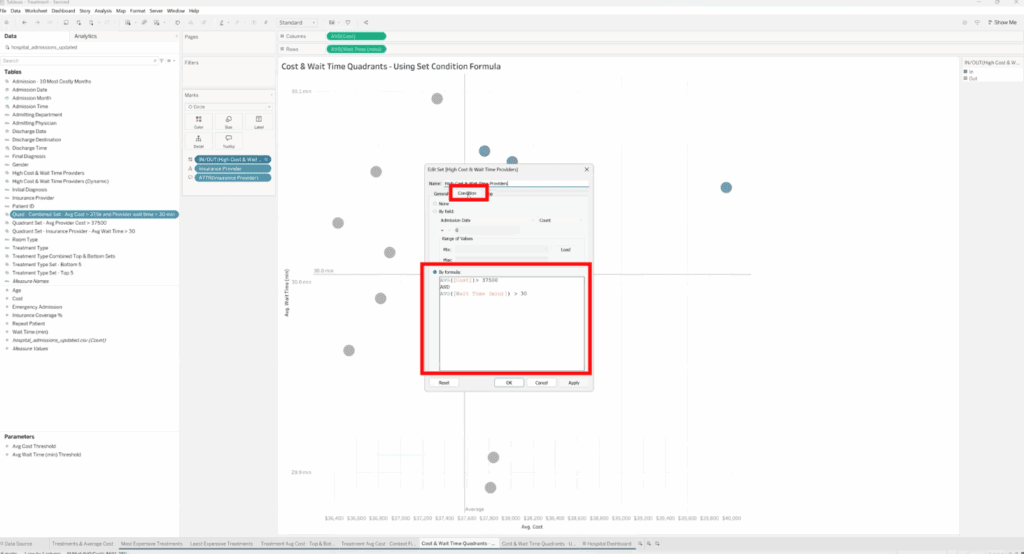
You can build a dynamic condition directly in the Edit Set dialog instead of maintaining separate sets.
Edit your existing set and go to the Condition tab. Switch from selecting by field to using a custom formula. Replace any hardcoded thresholds with a parameter reference (e.g., [Average Cost] > [Cost Threshold Parameter]).
You can also, create a parameter control and display it as a parameter legend in your dashboard.
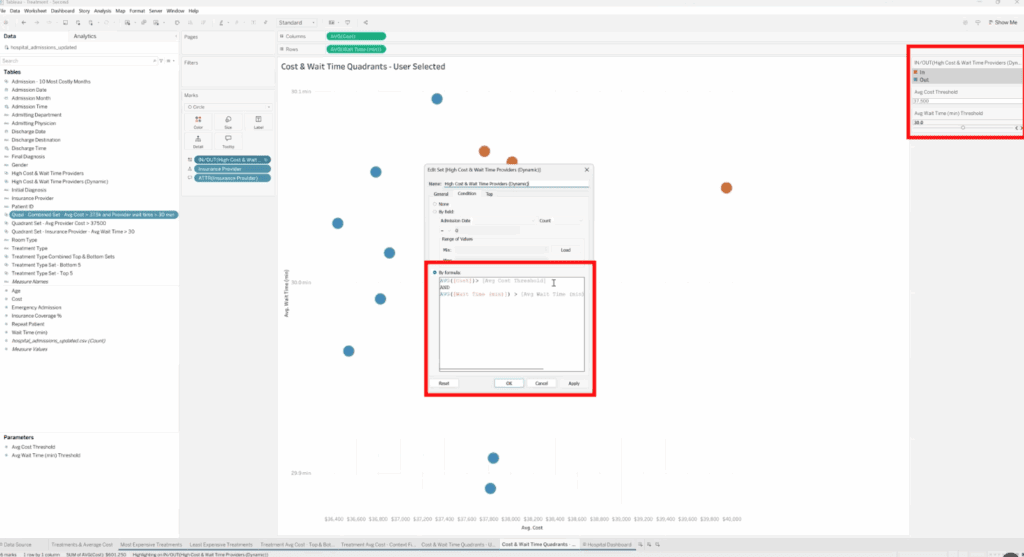
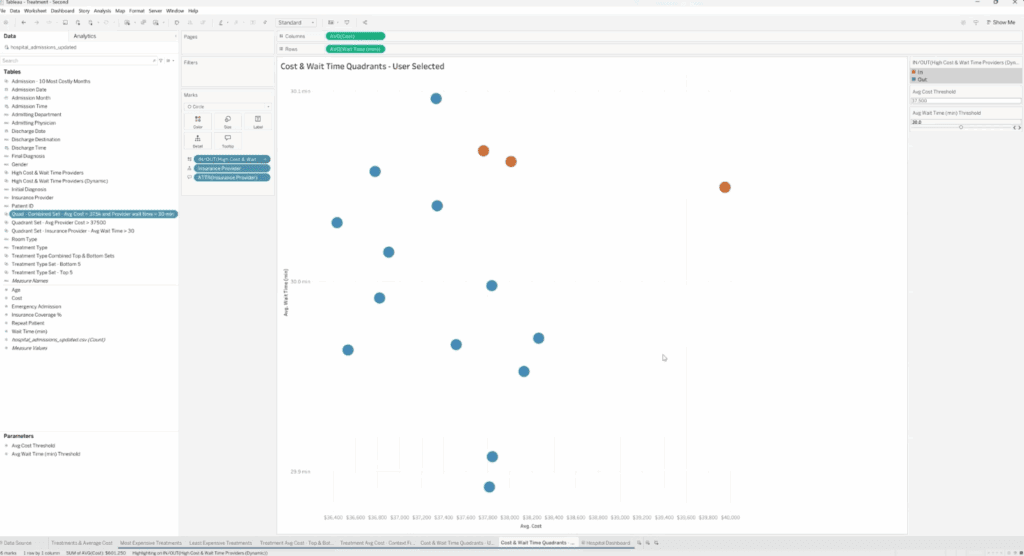
When users adjust the parameter value, Tableau updates the condition dynamically — only highlighting data that meets the new criteria.
Why Sets Matter in Tableau
Sets empower analysts to isolate patterns, compare specific data segments, and create responsive dashboards that reveal deeper insights. Whether you’re identifying top-performing categories, comparing key business metrics, or building interactive filtering systems, sets give you flexibility and control.
With practice, you can combine sets, parameters, and context filters to build powerful analytical frameworks that adapt dynamically to your data.
Need Help with Tableau?
At XeoMatrix, we help organizations unlock the full potential of Tableau. Whether you’re creating advanced dashboards, using sets to drive comparisons, or exploring dynamic analytics, our experts can guide you through best practices and performance-optimized designs.
Let us help you transform your Tableau environment into a powerful decision-making tool. Contact us today for tailored Tableau solutions designed to meet your business goals.