The Data-Driven Community Meetup holds monthly webinars on business analytics and big data. Webinars are held on the second Wednesday of the month at noon (12:00 PM) Central Time via Zoom Webinars and will cover topics related to enterprise data management. Our goal with each webinar is to provide meaningful insights and actionable takeaways to simplify analytics so you can make better decisions.
We cover topics such as data strategy, data management, data warehousing, BI modernization, embedded analytics, and cloud migration and strategy. Learn how to build reporting solutions that drive your business demand based on your needs.
About the Topic
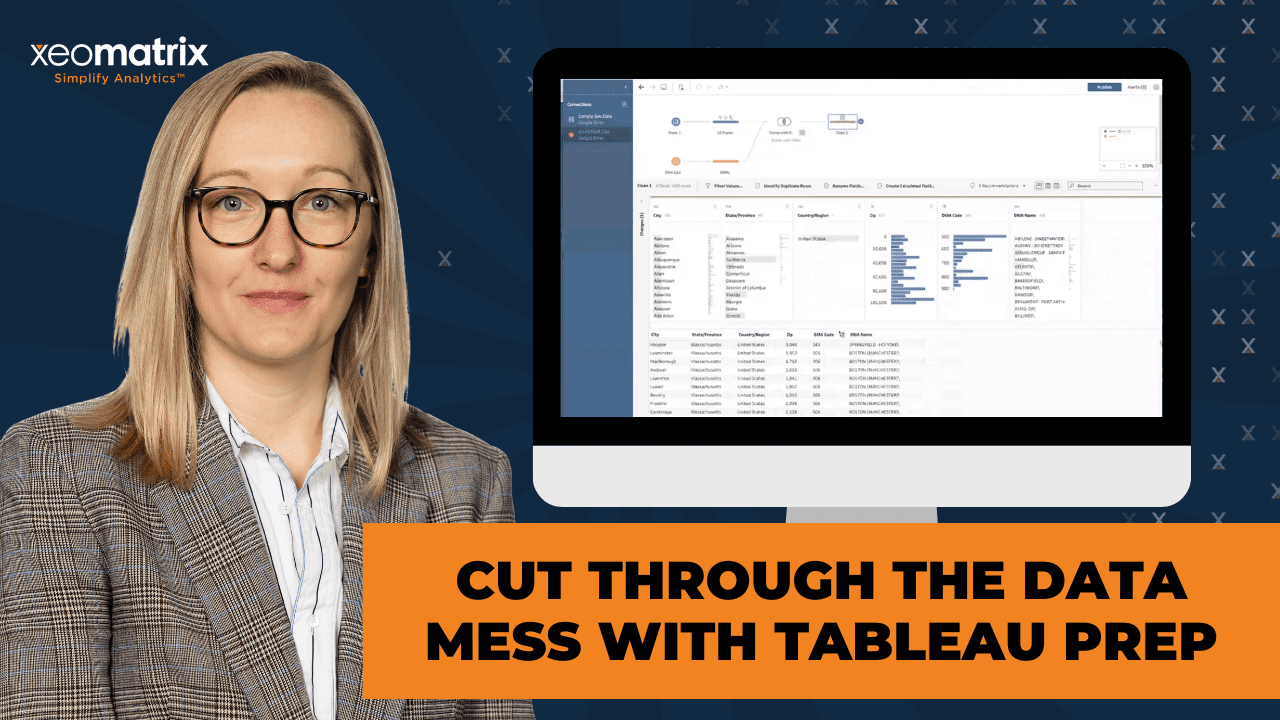
Struggling with messy spreadsheets or disorganized data sources? This webinar is a practical session on how to use Tableau Prep to clean, combine, and prepare your data—fast.
Tableau Prep makes it easy to bring order to the chaos, even when you’re dealing with multiple Excel files or inconsistent data formats.
In this recording, we walk through real-world examples of how to transform unstructured data into clean, analysis-ready datasets—no advanced coding required.
What we covered:
- How to bring together multiple Excel sheets in Tableau Prep
- Tips for identifying and fixing common data quality issues
- Building flows to automate repeatable data cleaning tasks
- Best practices for organizing data for Tableau dashboards
This article includes a recording, transcript, and written overview of the presentation on Cut Through the Data Mess with Tableau Prep (On-Demand Webinar).
Cut Through the Data Mess with Tableau Prep Presentation Video
Cut Through the Data Mess with Tableau Prep Summarized Presentation
In this hands-on session, Lauren Cristaldi will guide you through the core functionality of Tableau Prep Builder, Tableau’s visual data preparation tool designed to simplify complex and messy data. Emphasizing practical usage over theory, she demonstrated how Prep can help users efficiently clean, shape, and combine datasets before analysis in Tableau Desktop.
Session Outline
- Starting with Sample Flows
- Input and Clean Steps
- Powerful Cleaning Features
- Working with Data Transformations
- Union, Joins, and Pivots
- Outputs and Publishing
- Final Tips
Starting with Sample Flows
Tableau Prep’s strength lies in handling multiple data sources, such as CSVs and Google Sheets, allowing users to easily connect to and combine disparate files—including those updated on a schedule or collaboratively edited in real-time—into a single, unified dataset. Tableau Prep’s visual interface makes it easy to import various file types, perform initial data validation, and identify inconsistencies before the data reaches Tableau Desktop, thereby improving both performance and workflow efficiency.
The platform is ideal for users who frequently deal with updated data or manually entered inputs that often contain inconsistencies.
Input and Clean Steps
A key practice in Prep is adding a clean step immediately after input. This step allows users to explore columns, inspect data types, filter out irrelevant or null values, and apply preliminary transformations.
Lauren emphasized the importance of renaming steps and adding descriptions throughout the flow to improve readability and reduce confusion, especially in extensive, multi-step processes where it’s easy to lose track of what each step is doing. While you don’t have to name every step, make a point to label significant ones, such as major joins or transformations, to make the flow easier to navigate later. In addition, while step names can get cut off in the visual interface, descriptions are always fully visible, making them a reliable way to document logic and provide clarity for collaborators or future revisions.
Powerful Cleaning Features
Tableau Prep allows for intuitive cleaning of messy data. You can:
- Normalize inconsistent entries (e.g., fixing different spellings or formats of “Alabama”)
- Trim spaces, change text casing, and remove punctuation
- Use calculated fields for complex cleanup (like extracting numeric parts or standardizing formats)
These actions, done in Prep, reduce the burden on Tableau Desktop and improve performance.
Working with Data Transformations
The session dove into advanced cleaning techniques, including:
- Data type conversions (e.g., string to number)
- Grouping similar values (e.g., “AZ” and “Arizona” as one)
- Reordering and understanding the sequence of steps, which affects downstream outputs
Lauren likened the workflow interface to Excel’s Power Query but noted Prep’s visual interface as more intuitive and aesthetically pleasing.
Union, Joins, and Pivots
Lauren covered:
- Unions, for stacking datasets with similar columns (e.g., combining budgets and actuals), including manual mapping of mismatched fields
- Joins, including right joins to identify mismatches between datasets like returns and orders
- Pivoting, to transform columns into rows or vice versa—a particularly helpful technique for working with data like census files
Always insert a clean step after unions or joins to review results, rename fields, or handle duplicated columns, such as Order ID and Order ID-1.
Outputs and Publishing
The session included how to:
- Create outputs as files or published data sources to Tableau Cloud
- Schedule flows using the Data Management Add-on (required for automation)
- Manually run flows and publish them to Tableau Cloud for easy editing and execution
Lauren demonstrated an end-to-end example using Google Sheets as a data source to connect zip codes with U.S. states and publish the resulting dataset.
Final Tips
In closing, Lauren showcased a massive Prep flow she built for an Iron Viz project about LEGOs. It integrated various sources, including IMDb and custom Excel files. She emphasized the importance of naming steps consistently in large flows to stay organized.
The session concluded with a brief discussion on automation limitations without the Data Management Add-on and a reminder of the flexibility and power of Tableau Prep for cleaning, transforming, and combining messy data, making it a critical tool for any Tableau user tackling real-world data chaos.
Transcript
>> CELIA: Here we go. Okay, Lauren.
>> LAUREN: I like the “Let’s get prepping!”
>> CELIA: [laughs] I guess you’d like that. Good deal.
>> LAUREN: You know me.
>> CELIA: Yes. Over to you, my friend.
>> LAUREN: Okay. I thought we could start with a few sample flows to get here. Why don’t I show you? If you open up Tableau Prep Builder. It’s a separate app from desktop. It is on your PC. It’s not in the cloud. You are able to create and edit flows in the cloud. If you have the data management add-on, you can also schedule the different flows to run. We’ll get into that more towards the end. You should see a screen that looks like this if you’re wanting to follow along at all. There’s some sample flows down here, just out of the box to play with, that I thought would be good to start with.
You go to our Superstore flow. You can see that there are a lot of CSV connections, text files. We have all these different options. Let’s say that you have several different files that you need to bring into Tableau Desktop. Maybe they get updated on a schedule, or maybe you have a Google Sheet that people are constantly writing in new fields. This is a really good tool to use when you want to bring all that together before you try to do it in Tableau Desktop.
In addition to that, Tableau Desktop, in the Edit Data Source pane, you’re able to bring all these things together, but we’re kind of limited in what we can manipulate. Take some of that load off the front end, like with calculations or anything like that, that you could do some of these manipulations. You do that back here, which is better for performance, which everybody loves.
This is a good example of just best practices, also. You want to do a clean step after your input. This input would be one of our sheets over here. It gives you a nice summary. Even, let’s say, you’re just trying to do some data validation, or you want to explore which tables to use in whatever data that you’re using, this can also connect to different databases. You can come here, and it’ll give you a whole list of all the columns, a preview of those columns, and the type that they come through as, which is really nice to see in that summarized view. I’ve used it a lot for data exploration.
Then we add that clean step. To do that, you just see this little plus sign, clean. Then we have this pop-up. You can name these steps. The default is just going to say Clean 1, 2, and so on. You can rename. This is named Remove Nulls. Now, I’ll admit, I try to name all of my steps, but sometimes I get lazy, and I don’t. Then I go back to the same flow that I’m using. Let’s say I have this enormous flow, and I’ll actually show a good example of an enormous flow. Most of the time, I try to name at least the big steps. Like, you’re bringing things together. Okay, I need to remember that I was joining Orders South and Orders East, or if I’m doing any major manipulation, just putting something in there to describe that. You can also add descriptions, because sometimes the names get cut off, but the descriptions will always show in full, which is nice, right below the name.
Down here, we have just a summary view of what we’re doing. We can start to manipulate. If anyone has used Power Query in Excel, it’s kind of like the Power Query editor view, but it just looks a lot nicer, because it’s Tableau. It’ll give you the order of the steps and manipulations you’ve done. This is, I’d say, a light ETL tool, because we are doing transformations, and we’re bringing different pieces of data together. Over here, we just have one, and we’re just filtering out. We want to get rid of all those null order IDs. They’re not relevant in this case. You could also filter for certain states, maybe. Sometimes it’ll give you recommendations, which is also nice. Like we want State to be changed to a role as a state or province. Oh, and then it gave you another pop-up, too.
Sometimes, especially if you are using data that’s been manually entered, it can be kind of a mess that’s not a pick list. It’s not consistent. I’ve used this before on different projects where maybe someone said Alabama, but there’s a space, and now we have two Alabamas, or an Alabama with it not being proper case. We have three different instances. You bring it into Tableau Desktop, and you’re trying to make a map, and then it can’t find all of those locations because you have to go through and then change it or tell it to edit locations and tell it where it needs to be. In Prep, we’re able to just go through. We told it state or province. A lot of times, it’s smart enough to know, “Okay, then Alabama” lowercase would be uppercase, let’s clean that up more,” which is nice.
Other times, you have to tell it. We could go in, and we could create a calculated field and say all proper case, or even here, we can clean further, and we can make everything uppercase, lowercase, title case, which would be the proper– We can trim the spaces, too, which is nice. In this case, this one doesn’t need it, but if we had any of those leading or trailing spaces, it would clean those up. It’s just nice that if we did that in desktop, all of those steps would have to be calculated fields, which can be time-consuming if you’re having to do a lot of cleaning. Here, it just does all of them at once in the mid-end. It’s really powerful in that way.
Some of the other options, like we can filter by selected values. We can match certain values. Over here, we’re just getting rid of nulls for that order ID. Then we went through some of that clean– It’s also nice if you have where you have some fields that are weird, and maybe they have a number in them when they don’t really need it. Like, in this case, if Alabama had 2 or something like that, we can remove that, just different typos. We can also remove all the punctuation. If you’re trying to parse out a part of a string, maybe it has the pipe delimiter or something like that, then we can get rid of those. [silence] Any questions?
[silence]
>> CELIA: I don’t see any questions in the chat. You guys keep that in mind that that’s available for you. Just feel free to jump in there. I’d be curious to know how many of you have used Prep before. Feel free to chat that in as well.
>> LAUREN: I feel like it’s definitely underutilized. It’s a lot more powerful. I use it a lot. Just a lot. As much as I can. Oh, another thing to note with the changes is that these are in order. Let’s say I duplicate this field– [silence] We don’t need to worry about the trim spaces.
>> CELIA: Lauren, are you seeing the questions of, like, curious if you can see the SQL scripts that are being generated in the background behind these steps? Just curious about that in the chat here.
>> LAUREN: The SQL scripts behind the steps.
>> CELIA: Is there any visibility into how it’s accomplishing what it’s doing?
>> LAUREN: No, it’s within the application. It’s kind of like with Excel.
>> CELIA: You know how in some other apps, you can do that. Even in Tableau, there used to be a way to get into debug mode and see what it was doing. We’re just curious if the syntax is visible for the steps it’s taken.
>> LAUREN: That’s interesting. I’m not sure.
>> CELIA: I’m not aware of there being a way. That’s why I didn’t answer it straight out. Okay, cool.
>> LAUREN: I’ll have to look into that, though. I know you can do stuff with the metadata in a workbook. I wonder if you can do that with a Prep package flow. [silence] I’m going to look that up. Thank you. I’m going to learn something new. I do know that if you go here, it’s not about the steps, but you can add a new connection that’s custom SQL if you’re connected not to a text file, but an actual server or database. That would pop up here, like a regular connection of a custom SQL down here. Just thinking of custom SQL.
Going back to these changes. We duplicated that field. Now, if I change the name of this, let’s say, Field, State 2. Whenever you select one of these, it goes back to how it was during that step. When you click on the very last step, all of these have happened in order.
You want to be careful that if I change something here that I want to be in the next step for that new field, then those steps need to come before whatever I want to happen at the next level, if that makes sense. If I brought this up, this would happen before duplicating, and it would give us that error because this is trying to reference Atate instead of State 2. That renaming needs to come down. Always be careful about the order of your steps. As you can see, it’s really easy to reorder. [silence] Up here, we kind of did this.
There’s a Remove Letters, which we can look into. This is a calculated field. That’s what this icon means. If you want to edit that calculated field, you select that little pencil icon, and then it shows what was happening in that step for that calculation. Also, before that, say, you have a lot of fields coming through, I’ve seen this a lot. You’re in desktop. You have sales or, in this case, discount. They’re all coming through as strings, and then you have to make calculations to make them integers, or floats, or change the data type in general. This allows you to do that from here. Then it always applies that step so you’re not running into any errors when you go to refresh again.
To change that field type, you just click on the blue Field Type icon up here in this pane, and you would just change that data type here, or you can assign it different data roles as well, like geographic, with the different distinctions. Again, we have our recommendations, which is nice. This Prep is trying to anticipate what we might change based on the data it’s ingesting. There are a couple of changes here. Change type of sales to number decimal. [silence]
Another cool thing is you can do groupings. This could be to clean stuff up or you just want certain groups. It looks like this was to clean things up because the original, if we were to– Let’s edit those groups. If we select Arizona, yes, it looks like Arizona was keyed in as AZ or Arizona. This way they are combined. If you have new things come through, like this Nevada, it looks like, isn’t a part of anything. Let’s say I want to edit this– Oh, sorry. Say I want to make more groups. If I select Nevada, [silence] we’ll just say done. I’ll edit the value so that it matches everything. [silence] Now, every time I bring in new data, it’ll always change that to Nevada instead of having the NV if it’s keyed in that way.
>> [PAUSE 00:16:06]
This one has a few more. With these, it can be kind of annoying if you’re removing a lot of fields that you don’t need over and over and then you have to go back. Let’s say, I want to go back and not remove any of these, let’s say. Then you have to go through and hit X for all of these. It can be kind of annoying. If, instead, I hide them first– I’m just picking some random ones. Oh, and to highlight multiple, I select one and then Shift and you select the last one or you can do Command or Control if you want to select ones that aren’t in order like this.
Select all of them. Then I hide the fields before I delete them. This way, I can then highlight in that same way with Shift. I’ll remove all of those fields. Now they’re all grouped together. That step is just one step. Even though I’m removing several fields, it’s all grouped together. If I wanted to go back into that list, I just scroll. They’re all hidden in this nice list, and I can unhide them and then go through and delete them again.
>> [PAUSE 00:17:59]
Seeing if there are other– Yes, we have more calculated fields where you can split things up. You can rename your fields.
>> [PAUSE 00:18:23]
Oh, and this is a good one to note, too. Say I eventually want to union everything, but this order central doesn’t have a region column like the other ones do, you would go to these three dots, create calculated fields, and it would bring up this calculation where you would just put that string of what you want to fall in that same column when you union everything together. That way, you can select from a dropdown that says central, west, or east.
>> [PAUSE 00:19:10]
These were all the notes. Let’s go to our union. Unions are good when– they’re more flexible in Prep than in desktop because you can tell it like, okay, State 1 is actually the same as State. I would select State 1 and I would add it to State. Now all of those are brought together. Now, the one you select first, it’s going to default to that name. It just added that state group in there. If I hit the back arrow. We’ll go in here again. I’ll select State. I can add State 1. Let’s say we wanted State 2 in there as well. Go back.
>> [PAUSE 00:20:16]
Sometimes it lets you put them together. That’s not happening. You would add that there, or you would go back into this file. I would either remove this field or rename it. Then it would go into State 1. Oh, I know why it wasn’t. I was getting confused. If we had State 2 and State 1, but State 1 was from, let’s say, the fixed states or something like that, or rename states, then it would let us add multiple, like do a manual union of multiple fields, but because those were both coming from the same file, so the green, which is here, it won’t let you do that from the same- well, not the same file- the same step that it’s originating from.
>> [PAUSE 00:21:40]
Oh, and it’ll also show you your different hidden fields and where they’re coming from. If I select one of these fields, it’ll show you a highlight of, okay, State 2 is coming from Orders South, remove nulls. Where a file path is coming from. It also has this visual indicator with that green so we know it’s only coming from the Orders South, remove nulls. That can get kind of confusing. Another thing I like to do is I’ll make everything in these, like from where it’s originating to that clean and if I did anything else, whatever input is going into this union, I would make it the same color just because I feel like it’s easier to keep organized. It looks like they did that here. It just was green up here. That way I can look and see purple is coming from central, or the west, or east.
>> [PAUSE 00:23:06]
That’s our union. Really, you want union if you’re adding additional rows and your columns are more or less similar or the same. I’ve used it a lot for accounting data when you have a budget and your actuals coming through, and you want all the same account codes, but maybe the dates are different or something else slightly different in those rows, and you want to mark it as the budget. Well, if we bring in a budget here and our actual general ledger information here, then we have two inputs. Once we get further down the flow, you’ll actually have a generated field. It has it here, but you can rename it later. It’ll save the table names.
From there, what I normally do is I will rename table names to be budget or actual. Then in the dropdown, it would have these sources. I would rename these values as well through that grouping that I showed earlier. It would say budget or actual. That way, by the time we get to Tableau Desktop, I can toggle between if something is coming from my budget or if something’s coming from my actual. It just makes the rest of the calculations a lot easier that you’re doing in desktop.
Sometimes we need to bring in just certain items, and they’re very different from our initial inputs. In this example, we want to just do a Right join. It’s nice, I like how it lays it out, what it’s doing. It’s saying, these were all the mismatches or things that didn’t have any matches. This is what’s being excluded from the returns. We had three returns that don’t have any orders. If I’m like, “Oh, that doesn’t seem right,” it gives me that visibility to go back and look at the data and see what happened to those three rows, why aren’t they matching?
It also will show you over here. If I only show mismatches, I can see that these products and these orders didn’t have any matching IDs from my initial inputs. That’s great too, because sometimes you have data missing, but without that extra layer of visibility, it can take a long time, potentially, to figure out where those missing items are coming from. Here we can add more join clauses. We can have a list of different changes. It looks like a lot was changed to add these together. [silence] That’s generally where you would see all of those. [silence]
I’m joining on product ID and order ID. It looks like those are the main ones. For this one. If you have dates, you could join on different dates. Maybe you just wanted to join on the month because maybe the day of the month isn’t going to match perfectly, but you just want to see everything that happened in January, regardless of where it’s coming from. Then we can add those in there as well. It’s going to further constrain what we get at the end. It’s always important to add a clean step, especially after you do a join, before you do anything else, because you want to check everything after the join and be able to go through and clean up anything.
Like here, we’re removing fields or renaming a field. When the join happens, it’s adding in– we’re joining on order ID, it’s going to have that order ID one pop up. You can tell which one is Order ID 1 or where it’s coming from. It’s always going to be the second to the join. We brought this up, but on the left we have the Returns, and on the right we have that All Orders. The -1s are going to be generated from what we’re joining to. Ideally, they should all be the same or the one that you would want. [silence]
Then we can create an output. Here we have our output. We said this one is just a file. You can also have it be a published data source so it’ll go right to your cloud site. You would publish the data source somewhere on the cloud site first initially. This is what I like to do, at least. I’ll publish that first, and then I’ll go up here and publish the flow because that’s a different step. When you publish the flow, it’ll go to the cloud site, and you can run and edit on the cloud site.
>> [PAUSE 00:29:17]
That was just one of our outputs. Then it looks like here, if we want to roll up those sales or pre-aggregate, we’d add that aggregation step. You’d put in just those fields that you want to aggregate. If we want the rolled-up totals for each year in each region, this gives us that summarized aggregated view.
>> CELIA: Hey Lauren, pardon my need for interrupting. Before you go on too much further, there’s a question. “You’ve just been renaming some things and talking about that. Can you rename the default from -1 to the table name as a prefix?” That was a question from Frank in the chat.
>> LAUREN: Yes. You can rename that -1. If you didn’t want to get rid of it, we would just go here. You can’t change it as the default. It’ll always generate that if you’re joining. We would just go into this next clean step and you would tell it “Rename this as Order ID.” If I look up here in the search, I can find that -1. If we take it out, right now, it’s going to say that there’s already a field called Order ID. I would need to remove this one in this case. [silence] Then we can rename this one if that’s the one you want to keep.
>> CELIA: Instead of removing it altogether, I mean, eventually you’re going to want to remove it, but couldn’t you just say something like Order ID Source or something like that?
>> LAUREN: Yes, if you want to keep it, then you can always rename and just have that there as an indication of where it’s coming from. It’s coming from the return, so it could be Order ID Returns or Order ID: All Orders. In this case, the -1 is coming from the All Orders. [silence] Just double-checking this. Yes, nothing happened there. [silence] That’s a good question, though. [silence]
Another one of the steps, because here you can see with that plus sign, so we went through the clean steps. Our union joins an aggregation. New Rows is just when you want to insert new rows. I don’t use that one very often. I think another one that I use often, though, would be Pivot. Let’s say you have columns that you want to be rows, or rows that you want to be columns. Here you can change that, and you can do vice versa as well. I want to leave Region the same as it was being listed, but I want the quota in year to be in that same per row list. It’s really nice with census data if you can get it in a format that’s not those crazy merged rows that they have sometimes with the totals and whatnot, for anyone that’s used census data.
I’d say Prep is a godsend with trying to prepare census data to go into Tableau. It’s nice to be able to do that pivoting in Tableau Prep. Then, when we get to our join, we can join on both the year and the region, whereas otherwise we could only join on region, and we’d have all these columns for those different years. [silence] Then this would be our output after that. I’d say, really, you should add a clean step here. This way we can check everything. If we want to do any final renaming, we can do that here. It’s also nice having clean steps between everything because if you see something fail, and you want to pinpoint where exactly it failed or if an alert pops up, it’ll notify you and direct you to the right place in the flow. Here’s a good example of where I don’t want Region 1 or I want to rename it. I can remove that, and now our output won’t have both of those region fields. [silence]
Now we only have about 17 minutes. Any questions? Then I was going to show how to connect to Google Sheets and publish a flow.
>> CELIA: One other thing is you’re talking about outputs, Patricia had a couple of specific questions about moving data from Prep to SQL, both on and off the cloud. Sounds like it works really well when she’s not on the cloud, but having some potential frustrations with it when she’s working with Prep on the cloud. I may have misunderstood her. Patricia, feel free to elaborate right there.
>> LAUREN: Patricia, you’re asking about moving–
>> CELIA: She’s unmuted. I might just let her say her version of it. Patricia, please go ahead.
>> PATRICIA: You said it correctly. With the new version of the cloud, I was told that I’m not going to be able, if I have local flows in my computer, I won’t be able to output to SQL. It will be okay if I have the flow in the server and I schedule the flow, it will do it, but it won’t do it on my computer like I currently do.
>> LAUREN: With that, it depends on where that database is, where it exists. Does it exist in the cloud? Do you have permissions set up so that you’re able to publish to a table in that database? It’s really a permissioning and also the server, like the mainframe.
>> PATRICIA: I can currently do it because I’m not in the cloud yet.
>> LAUREN: Right, yes, with server, it’s different because you’re hosting the server, so you’re able to have more permissions to do that.
>> PATRICIA: I can find it, but I saw the same thing in one of the requests that a person had in Tableau asking the same question because she says she’s finding problems now that she cannot write to SQL server, but it’s not answered to her request yet. I can’t find it.
>> CELIA: Is her SQL server on the same cloud instance, or is it also local?
>> PATRICIA: It’s a different instance. It’s not cloud. It’s not local. It’s another server managed by OTS.
>> CELIA: Managed by? Say that last part again, please.
>> LAUREN: By OTS?
>> PATRICIA: Yes, our office of IT, of technology. It’s the same server that I’m using right now. Tableau has rights to do it, so I can bring a lot of tables and make a flat file and send it to SQL. I can do that as of today, but with the cloud, I was told you’re not going to be able to do that from your computer. We are about to move it into the cloud, so I need to know if it’s going to be a solution or something. I saw what Frank wrote. Frank explained something there, but I’m not familiar with whatever he said.
>> LAUREN: I’m actually helping with that migration. We can talk more about that, because I think Kevin from our team and Christian from our team would be better to answer that than me, just because I haven’t done that too much, and they’re doing the thing.
>> PATRICIA: Thank you.
>> LAUREN: Of course. We’ll talk to Chris from OTS, too.
>> PATRICIA: Perfect.
>> LAUREN: Brilliant.
[silence]
Any other questions? I’ll try to run through.
>> CELIA: Frank, did you want to just say out loud what you typed in the channel, in case that’s helpful to everybody?
>> FRANK: Sure. We were told the same thing. We just migrated. We’re in the process of migrating from on-premise Tableau server to cloud. We were told by all the salespeople and everything that you cannot write Prep flows to an on-premise SQL server. We went ahead and purchased MuleSoft and then found out we could do it. Basically, the Tableau Bridge that allows connectivity from Tableau cloud to on-premise data will not allow you to write Prep flows back down. However, if you do firewall work and do a direct connection from cloud to your on-premise SQL server by whitelisting the IPs, you can go ahead and write Prep flows down to an on-premise SQL server that way.
>> CELIA: That’s great.
>> LAUREN: That makes sense. That’s what I was thinking with the permissioning and whether it’s on-prem or in the cloud. The same thing, a smaller version of that would be with local Excel spreadsheets. If you’re trying to connect back to those, then that needs to be permissioned so that cloud can access a local drive or a shared drive.
>> FRANK: Yes, that’s all through Bridge.
>> LAUREN: Yes, exactly, with Bridge.
>> CELIA: You were able to get this other done with MuleSoft, right, Frank?
>> FRANK: No, we were told we couldn’t do it the way that we’re doing it, so we bought MuleSoft, but we’re not using it. We just decided to direct connect from cloud to our on-prem SQL server.
>> CELIA: Very good, okay.
>> LAUREN: I’m going to make a note of that.
>> CELIA: Microsoft wasn’t suggesting that you upgrade to Azure or anything like that?
>> FRANK: Our primary software is on non-prem SQL server, so our primary software that we use to run our resort is on non-prem SQL server, so we need to bring that data down.
>> CELIA: Yes, makes sense. Thank you for that, appreciate it.
>> LAUREN: Yes, thank you. [silence] All right, in the last 10, I’m just going to go really quickly through another one I made. [silence] Let’s go through. We can do this one. Here I’m connected to Google Sheets. To connect to a new one, you just go to Connections, hit that plus sign. I go to Google Drive, and then it would authenticate and would show me everything in my Google Drive. I preloaded these because I have a lot of sensitive stuff in my Google Drive. These are the Google Sheets that I want to reference from my drive. They’re connected. As long as you have those credentials saved in your settings on your cloud account, you’ll be able to schedule, and you have the data management add-on, you’ll be able to schedule a refresh of those.
Let’s see. I want to bring in this. In this example, I want to connect some DMA zip codes and names to the actual states and cities that they’re related to. These are marketing areas, basically. I added those clean steps, now I can bring in to join. I selected this Clean 2 and dragged it on top of the Clean 1. I’m going to use zip code or postal code. This is a good example here because in my first input, which I will rename as US states. I don’t need this index, so I’ll remove that. My postal code, which can also be my zip, should really be a full number, so I’ll change that type here.
In this instance, I only want to look at the United States so I’ll do that filtering there on country and region to exclude the other, well, Canada. Sorry, Canada. Then, this will be our DMAs, rename that step, go back to our join. Now, if we add in postal code to zip code, and I just want to see the states that have those DMAs in that file that I brought in.
>> [PAUSE 00:45:42]
Now, I can review that. I’ll rename this join to be States of DMAs. I’ll also show an example of the description because there, it’s getting cut off. I’ll write it again.
[silence]
Now, it’s all showing up with that description. I’ll add another clean step. In this case, I just want the zip code. I can remove this other field. [silence] I could change some data roles if I wanted, but it’s good for now. [silence] Now, for our output, I’m going to do Publish Data Source. Just put it in Demos. I’ll say, US DMAs. [silence] You can either create a new table or append it to the table. If you have things where it’s going to change every month, but you want to keep a record of how it was before, you can just append it. If you want everything, like let’s say something changed from the last time that you loaded a sheet, you can just create a whole new table. It’ll refresh the whole thing.
Now, I can either hit Run Flow or this icon up here. I’m just going to hit Run Flow.
>> [PAUSE 00:48:08]
I’ll do all the sign-in steps.
>> [PAUSE 00:48:31]
Now we can see it on our cloud site. That’s the published data source. If I go back and I publish the flow–
>> [PAUSE 00:48:59]
It looks like I already have the authentication embedded. That’s good. We can publish that.
>> [PAUSE 00:49:29]
Now, from here, I can either schedule that flow to refresh, or I can run it from here if I want to do a run right now. I can add different tags to it if I have a lot of different flows going on. It’ll give you this nice overview of what’s in that flow. You can also edit it within Tableau Cloud if you need to make a change. [silence] I know that was kind of quick. Before we end with questions, I just wanted to show this megaflow. I used this to create the data source for my Iron Viz entry last year. I did LEGOs, because I love LEGOs. I went through and I found all these different Excel files, and I gathered a lot of information. It was in all these different sources. I also wanted to bring in the IMDb, the Data+ TV that Tableau released, and bring in the different movies, but only things that were LEGO-related. I did all of this Prep work to bring those together.
It’s just a good example of when you have a lot of steps going on, it’s really good to name things because you can get lost in the flow. Any questions before we have to go?
>> [PAUSE 00:51:44]
>> CELIA: There was one question in chat about being able to automate refreshes without the data management add-on. Do you see that, Lauren?
>> LAUREN: You can’t automate without the data management add-on. That is a limitation. I do have some clients that still use it, though, and they just have a reminder that it needs to be run like once a month. I would say if you’re trying to run it once a week or less, then it might be good to look into that data management add-on.
>> CELIA: Any other questions, folks? [silence] It seems like RStudio is the backup plan there, right? It’s nice to have a Colorado Contingency here today, y’all. Thank you for being here. Yes, no doubt.
>> LAUREN: I love all the messages in the chat.
>> CELIA: Yes, [chuckles], right? Yes, thanks, y’all. Yes, very good. Thank you, Raymond. I appreciate that. All right. Well, Lauren, thank you so much for walking us through this and landing the plane and sharing a little bit from your Iron Viz submission. That’s fun. I learned something about you new today. We’ll look forward to having you guys be publishing what we’re doing next, and then also look forward to connecting with you guys over time. Thank you so much for being here today, and we will be sending this recording out within a couple of days. Thank you so much.