
Tableau is a data visualization tool that helps you create modern, elegant data dashboards that are intuitive, automated, and exciting to support a strong data visualization strategy with Tableau for better business decisions. Tableau offers what other business intelligence tools can’t—an all-encompassing solution that empowers your internal data reporting and embedded analytics, essential for growth and productivity within your business.
A proper data visualization tool can help you quickly consume data, blend information, and transform it into customized data dashboards to fit your needs.
You have to make informed decisions every day in the business world, but where do you get the data to back them up? Your organization likely has multiple data sources to draw from, such as your CRM and analytics platforms. The data in these platforms are all segregated and hard to understand.
This is where data visualization comes in. When you have a single data dashboard that can cut down the back-and-forth of multiple platforms, you can increase productivity and get the insight you need to make the most informed business decisions.
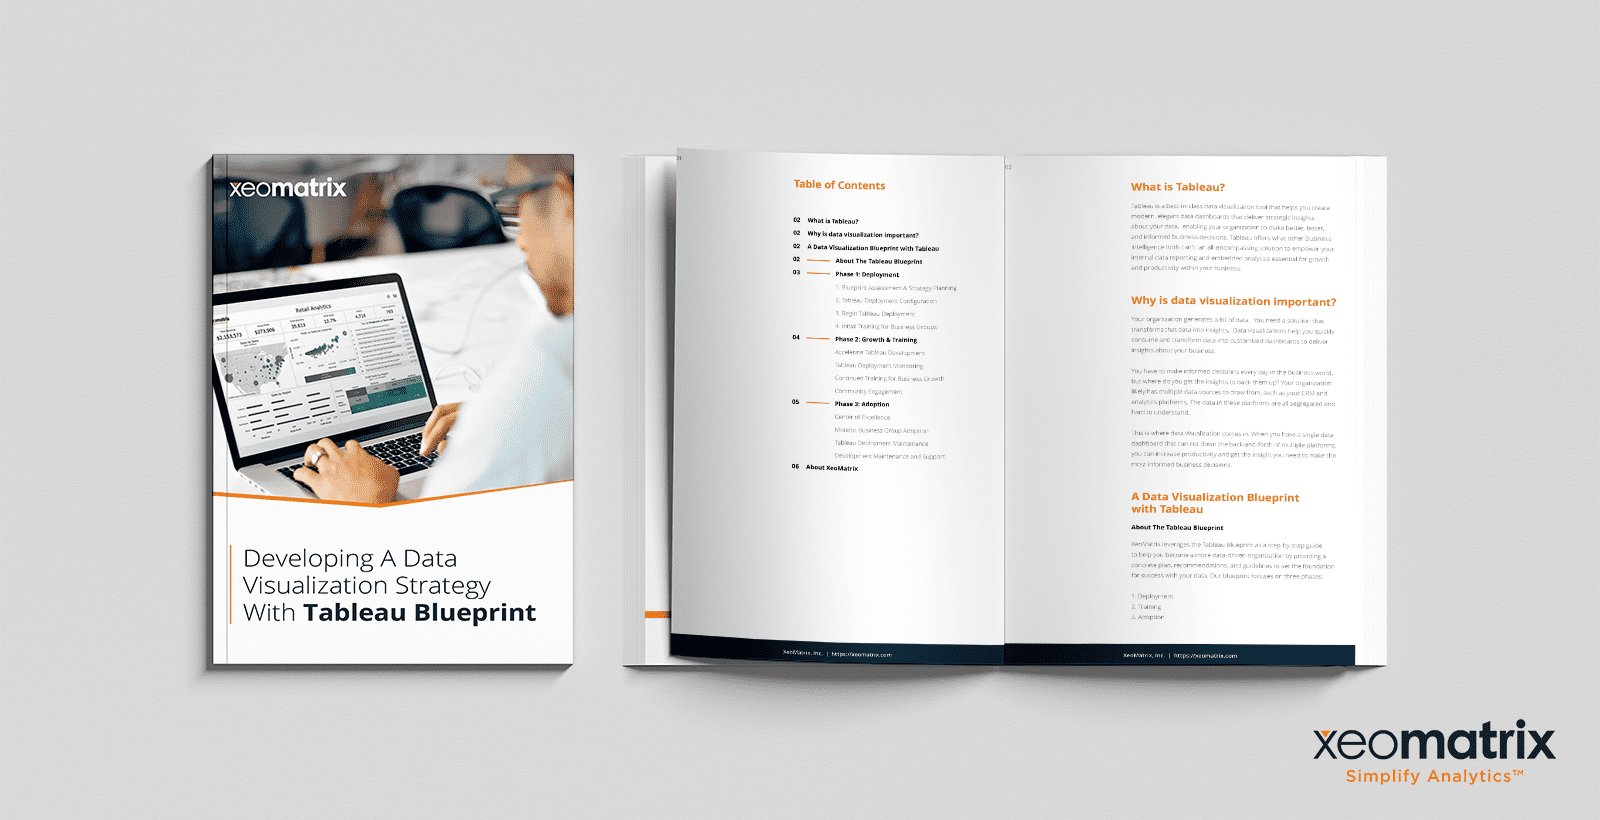
Download our “Developing a Data Visualization Strategy with Tableau Blueprint” whitepaper using the form below to learn more about how XeoMatrix can help your organization become more data-driven. Our Tableau Blueprint provides a concrete plan, recommendations, and guidelines to set the foundation for success with your data.