This webinar explores how organizations leverage Tableau to deliver robust embedded analytics to their clientele and partners. Hosted by the President of XeoMatrix, Chris Monahon, and Client Success Manager, Stuart Tinsley, this session offers a comprehensive showcase of Tableau’s embedded capabilities and their significance for business leaders like yourself.
Discover the power of Tableau in kickstarting the development of embedded analytics dashboards and gain invaluable insights on streamlining deployment processes. By integrating analytics seamlessly into your applications, portals, or systems, you can enhance engagement, unlock new revenue streams, and gain a competitive advantage in your industry.
Presentation Video
Summarized Presentation
This session summary outlines the key aspects and strategic implications of embedding analytics within various organizational frameworks using Tableau. Through detailed exploration of five distinct use cases—simple web pages, third-party applications, hosted Tableau, custom web portals, and customer-facing products—the discussion sheds light on the versatility and robust functionality of Tableau for embedding analytical tools into different environments.
Key topics covered include the definition and significance of embedded analytics, the identification of potential buyers, and the benefits it brings to businesses and their customers. The session further delves into practical implementations, showcasing how Tableau facilitates easy integration with minimal coding required, enhances user experience through tailored, white-labeled portals, and offers flexible hosting options.
The strategic insights provided aim to assist organizations in crafting an effective embedded analytics strategy by considering user needs, customization levels, maintenance requirements, and security measures. This comprehensive approach ensures that attendees can effectively plan and execute an analytics strategy that aligns with their business objectives and user expectations, leveraging Tableau’s capabilities to enhance decision-making and competitive advantage.
Presentation Outline
- Embedded Analytics: The Opportunity
- Introduction to XeoMatrix
- Crafting an Embedded Strategy
- Simple Web Pages with Embedded Code (iFrame/Javascript)
- 3rd Party Applications
- Hosted Tableau
- Custom Web Portals
- Custom Facing Products
- Conclusion
Embedded Analytics: The Opportunity
What is embedded analytics?
Embedded Analytics refers to the seamless integration of analytical tools and capabilities within various software applications aimed at enhancing user experience by offering real-time insights and data-driven decision-making capabilities. This integration is designed to function within the daily applications used by people, facilitating an environment where actionable insights are readily accessible without the need to switch between different platforms.
Who is buying embedded analytics?
The market for Embedded Analytics is broad and varied, typically encompassing three primary scenarios: external portal scenarios, solution providers, and information providers.
External portals are used by companies to share data with partners, customers, suppliers, and franchisees, enhancing transparency and collaboration.
Solution providers, often software companies, integrate data analytics within their products or services to enrich their offerings.
Information providers sell insights and data as a standalone analytic service, offering a unique value proposition to their clientele.
Why embedded analytics?
The adoption of Embedded Analytics brings substantial benefits to businesses and their customers. For businesses, it not only increases customer engagement but also introduces additional revenue streams and strengthens competitive positioning in the market. Customers, on the other hand, gain access to self-service analytics, enabling them to derive actionable insights and engage with rich and captivating content.
What we’ve heard about embedded analytics
Feedback from customers who have incorporated Embedded Analytics into their operations highlights several key benefits. These include streamlined external reporting, enhanced partner and customer relationships, quick integration, and the ability to create custom, interactive dashboards. A strong emphasis on security is also a common theme, with businesses seeking to ensure that data protection is a priority in their analytics offerings.
Build vs. buy embedded analytics
When contemplating the adoption of Embedded Analytics, businesses face a fundamental decision: to build their own solution or to purchase a pre-existing one. This decision hinges on several factors, including time to market, scalability, expertise, resource allocation, maintenance, and overall customer experience.
Building a solution in-house often means a longer development timeline, greater resource investment, and increased maintenance efforts. Conversely, purchasing a solution can lead to quicker deployment, reduced maintenance costs, and potentially a superior customer experience.
Case Study: IDBS
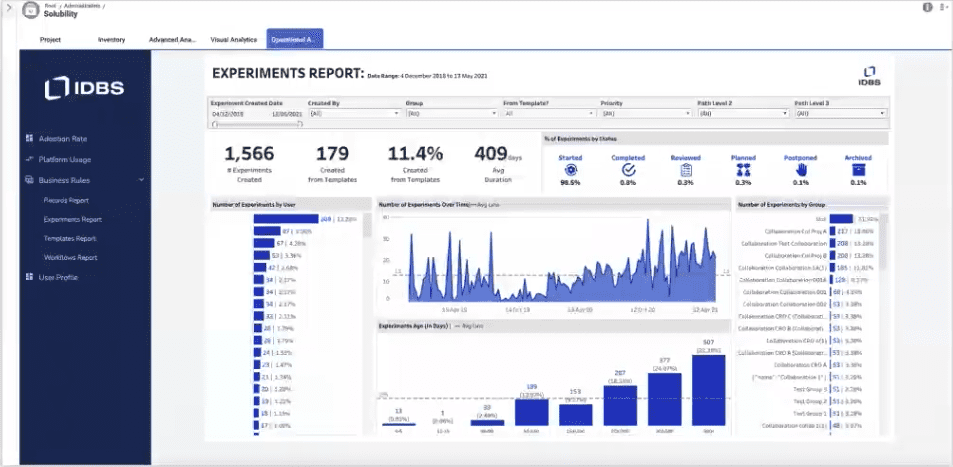
A notable example of successful Embedded Analytics implementation is IDBS, a company that supports researchers in identifying data anomalies and outliers. By integrating Tableau into their application, IDBS launched their Embedded Analytics solution in just three months. This rapid development allowed them to offer intuitive analytics tools to R&D organizations worldwide, empowering them with real-time, self-service analytics. The impact of this integration is profound, significantly enhancing the efficiency and effectiveness of laboratories globally.
Introduction to XeoMatrix
XeoMatrix, a distinguished Tableau Gold Partner, is based in Austin and takes pride in its active involvement within the Tableau community. Notably, XeoMatrix sponsors the Austin Tableau User Group (TUG), demonstrating its commitment to fostering a vibrant Tableau ecosystem locally. The company’s core mission revolves around supporting organizations in the deployment, training, and successful adoption of Tableau, encompassing a comprehensive suite of services to achieve this end.
XeoMatrix has identified and nurtured a specialized niche in embedded analytics. The company excels in guiding clients toward developing highly scalable solutions, leveraging Tableau’s power and flexibility. This focus underscores XeoMatrix’s expertise in harnessing Tableau’s capabilities for general analytics needs and optimizing its application in the specific context of Embedded Analytics.
Crafting an Embedded Strategy
What does it mean to be embedded?
The concept of “embedding” in the context of analytics refers to the integration of analytics capabilities directly into various platforms, such as portals, custom applications, or simple webpages. This can be applied to internal and external use cases, catering to various needs and scenarios. The embedding flexibility allows organizations to provide analytics in the most accessible and relevant contexts for their users.
Implementation options
There are several ways to implement embedded analytics, from simple web page integrations to embedding within third-party applications or custom web portals. Each method offers different advantages in terms of ease of implementation and the level of customization possible. The selection of an appropriate embedding method depends on the organization’s specific requirements and capabilities.
Embedding considerations
When planning an embedded analytics strategy, organizations must consider several key factors, including the identification of end-users, the type of analytics to be delivered, security requirements, whether the solution is internal or external, and the extent of customization needed. Understanding these factors is crucial in determining the development effort required, whether internal support or external assistance is needed, and the future maintenance and support implications.
Methods of embedding
Embedding Tableau dashboards can be achieved through simple HTML embed codes for a quick and easy setup or through more complex API coding for greater customization. While the embed code method is straightforward and requires minimal maintenance, API coding offers the flexibility to tailor the user interface more closely to organizational needs.
Tableau in the Cloud on On-prem
Organizations can choose to host Tableau in the cloud or on-premises, depending on their specific needs and security requirements. Tableau Cloud offers the advantage of no maintenance, and it is the preferred choice for many organizations due to its convenience. However, some may opt for Tableau Server due to strict data security requirements or other considerations.
Tableau licensing options
Understanding Tableau’s licensing options is essential for planning and budgeting for an embedded analytics solution. Tableau offers named user licensing for predictable usage patterns and a fixed number of users, as well as usage-based licensing, which is ideal for scenarios with a large number of users but infrequent access. This flexibility allows organizations to select the most cost-effective licensing model based on their specific usage patterns and needs.
Simple Web Pages with Embedded Code (iFrame/Javascript)
Integrating Tableau into simple web pages presents a straightforward yet powerful means of displaying analytics directly on public-facing websites or internal platforms. This method is highly beneficial for providing accessible information to a broad audience, as demonstrated during the pandemic with various public sector organizations deploying public dashboards.
A notable example is Redfin, which has successfully embedded Tableau within its website to allow users to interact with and analyze real estate data, highlighting market trends directly on their platform.
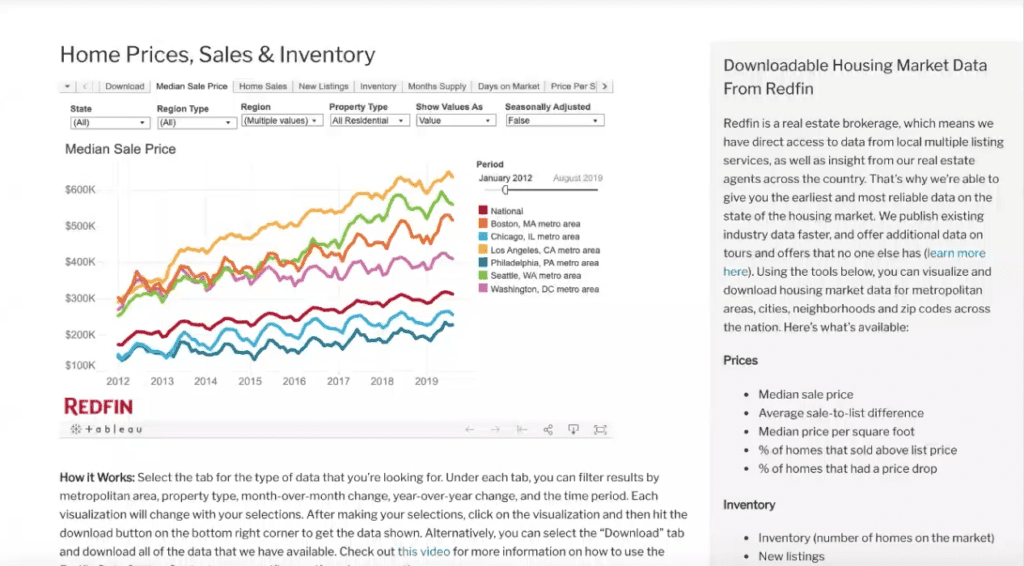
The process of embedding Tableau into a webpage is remarkably simple, requiring just the insertion of an embed code into the website’s HTML. This ease of setup eliminates the need for extensive portal development, making it an ideal solution for quickly sharing analytics. However, it’s important to consider that authentication may be required for accessing Tableau if the data is not intended for public viewing, ensuring data security and proper access control.
Another example is Hightech, a website created on Wix. An interactive and visually appealing dashboard was seamlessly integrated into the webpage by simply copying and pasting the embed code from Tableau into the Wix editor.
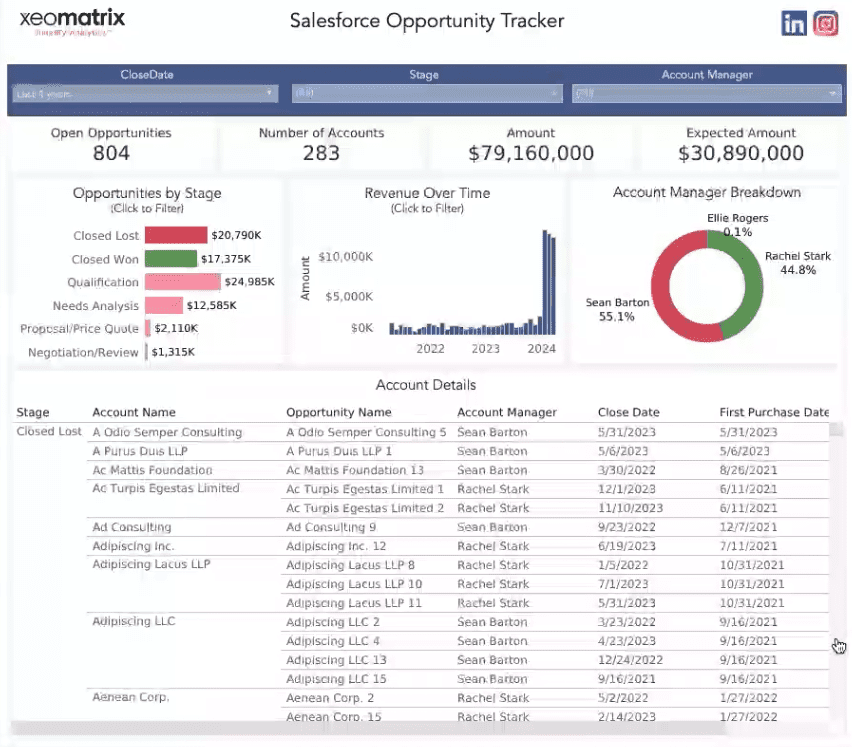
This ease of embedding, along with the minimal technical requirements, underscores Tableau’s versatility and effectiveness in enhancing web content with actionable insights.
Moreover, the evolving use cases for Tableau, such as integrating Tableau Pulse into portals, reflect the growing trend toward leveraging AI in analytics.
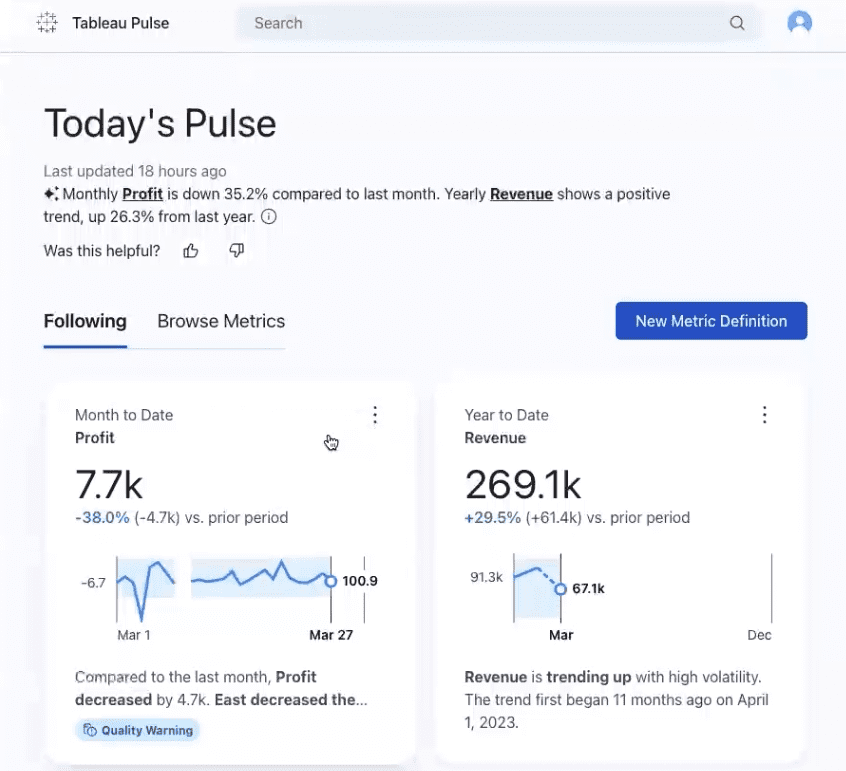
Tableau Pulse utilizes AI to analyze data trends and provide users with summaries and insights, demonstrating an innovative application of embedded analytics that goes beyond traditional dashboards.
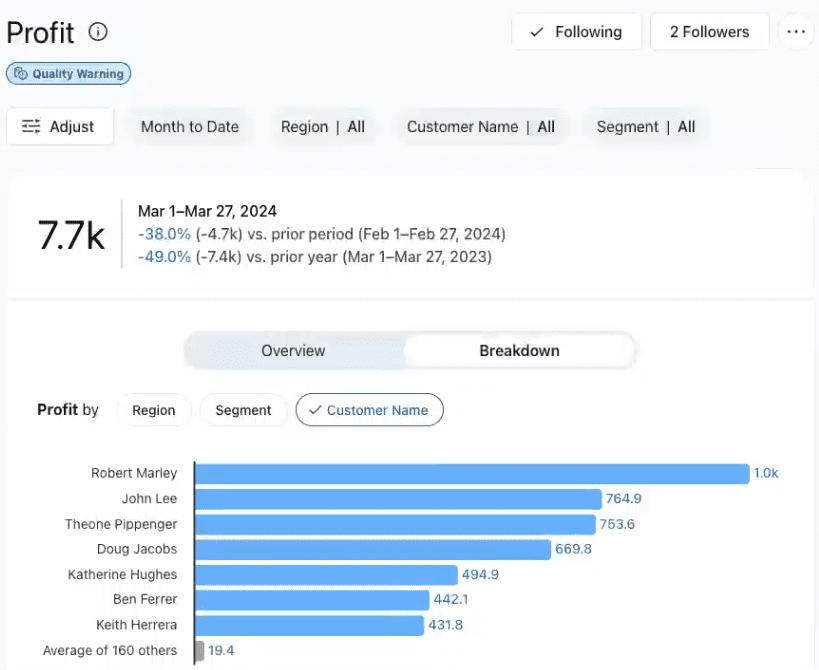
This approach not only enriches user experience but also offers a glimpse into the future of interactive and AI-driven data analysis within web portals.
3rd Party Applications
Embedded within SharePoint Portal
Integrating Tableau within SharePoint portals exemplifies a practical application of embedding analytics into third-party applications. SharePoint, commonly used for wikis, internal portals, and intranets, offers an accessible platform for embedding Tableau dashboards. This integration facilitates analytics accessibility directly where users are most accustomed to retrieving information, significantly enhancing user experience without requiring them to navigate away from SharePoint. The process involves simple embed code insertion, leveraging SharePoint’s compatibility with Active Directory or single sign-on systems for seamless user authentication and access control.
This example shows the simplicity of embedding a Tableau dashboard into a SharePoint portal, where a straightforward copy-paste of the dashboard’s URL into SharePoint’s editor enables the integration.
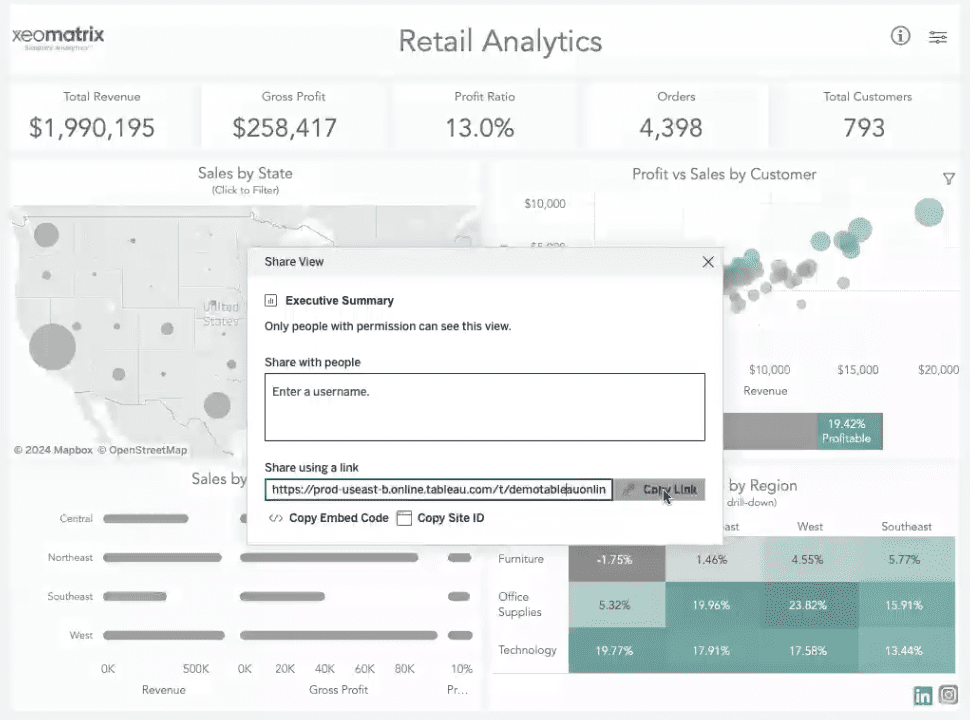
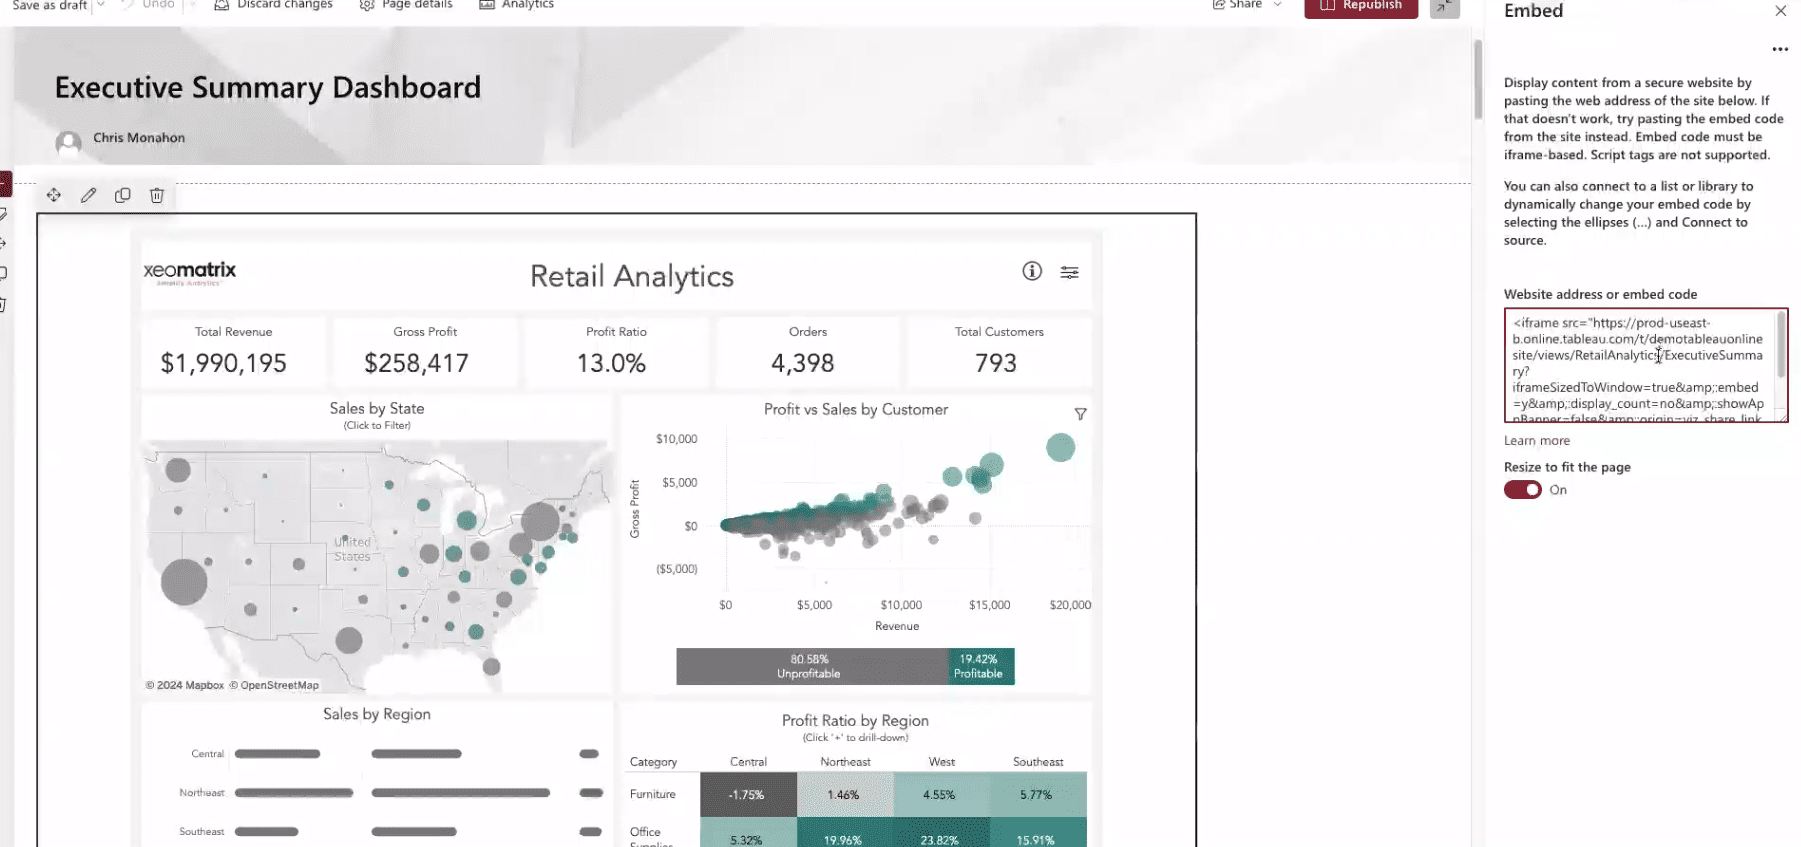
This approach requires minimal technical knowledge, underscoring the ease with which organizations can enrich their internal portals with actionable data insights directly within their existing workflows.
Embedded within Salesforce
Another impactful use case is embedding Tableau within Salesforce, leveraging the tight integration between the two platforms, especially given Salesforce’s ownership of Tableau. This integration is particularly valuable for enabling sales representatives and support staff to access and analyze data without leaving the Salesforce environment. The process bypasses traditional embedding methods in favor of the Tableau Viz Lightning component, a Salesforce-specific tool that facilitates the drag-and-drop addition of Tableau dashboards into Salesforce pages.
The integration allows for dynamic filtering based on Salesforce records, such as customer accounts, enabling tailored analytics that directly supports customer relationship management and sales activities. An example demonstrated the process of integrating a Tableau dashboard into a Salesforce account page for Ace Electronics, showing how the dashboard can dynamically update to reflect data for the selected account, in this case, transitioning seamlessly between Ace Electronics and Acme Corporation.
This Salesforce embedding showcases a powerful synergy between CRM and analytics, enabling businesses to deliver precise, contextual insights directly within the platforms their teams use daily. It highlights the broader potential of embedded analytics to transform business processes and decision-making by bringing data insights directly into the operational tools and workflows of various departments and roles.
Hosted Tableau: Out-of-the-box Tableau
Leveraging Tableau Out-of-the-Box represents an efficient and straightforward approach to implementing embedded analytics, especially for organizations seeking to minimize development efforts and simplify the user experience. This method utilizes the existing Tableau portal, providing end-users a robust and familiar analytical environment.
Many clients opt to provide Tableau Out-of-the-Box to their end clients, capitalizing on the platform’s widespread recognition and trust in its analytical capabilities. Familiarity with Tableau’s interface can significantly expedite user adoption, as both clients and partners are likely already accustomed to navigating and utilizing the platform. This familiarity not only boosts confidence in the data analysis provided but also enhances user engagement due to Tableau’s trusted brand identity.
This use case is particularly prevalent among organizations that prefer a low-maintenance solution, as all upkeep is managed by Tableau, especially in scenarios where Tableau Cloud is utilized.
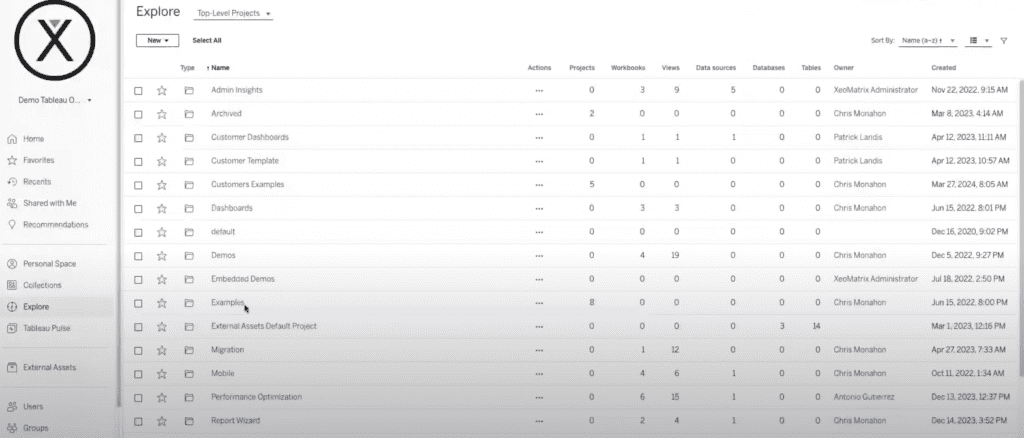
The Out-of-the-Box solution offers a comprehensive suite of analytical tools and dashboards without the need for additional coding or development, making it an attractive option for those looking to quickly and efficiently deploy powerful analytics capabilities.
By demonstrating the initial landing page and subsequent navigation within Tableau, users can access a wide array of analytics and dashboards immediately upon login, illustrating the convenience and accessibility of using Tableau Out-of-the-Box. This approach simplifies the analytical process and ensures that robust, high-quality analytics are readily available to all users, fostering a data-driven culture within the organization.
Custom Web Portals: Custom White Labeled
Custom web portals represent the pinnacle of embedded analytics, where the integration transcends mere functionality to offer a fully tailored, white-labeled user experience. This approach is particularly favored by organizations aiming to provide a seamless and branded analytical environment to their clients or partners without any overt indications that the analytics are powered by Tableau. Such customizations enable organizations to present a polished and proprietary interface while leveraging Tableau’s robust capabilities.
Creating a custom web portal involves more than just embedding analytics; it requires significant programming effort to ensure that the result is functional and aligns with the organization’s branding and user interaction expectations. Despite the initial development investment, the use of Tableau accelerates product development significantly. Organizations that build their custom portals with Tableau typically bring their products to market about 30% faster than developing solutions entirely from scratch. This speed is accompanied by reduced maintenance costs, adding to the appeal of this approach.
Custom portals also allow for the tiered monetization of features. Basic functionalities, like dashboard viewing, might constitute the entry-level offering, while more advanced features, such as the ability to create custom reports or access specific analytical domains, can be monetized as premium services. This tiered approach enhances the user experience and creates additional revenue streams for the providing organization.
An example of such a portal is the “franchisee portal” which showcases the adaptability of Tableau in a custom setting.
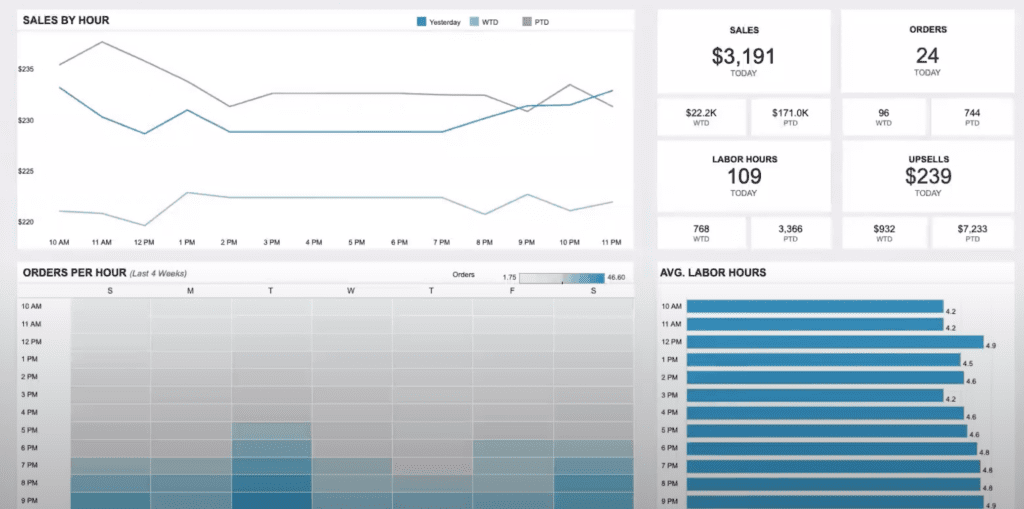
In this portal, users like store managers and regional managers log into a visually distinct space that integrates Tableau dashboards within a broader interface designed using a React front end. This customization allows developers familiar with JavaScript to easily manipulate the portal’s appearance and functionality using Tableau’s embedded API. A prototype of this complexity can typically be developed in as little as half a day to a full day, demonstrating the efficiency of using Tableau’s architecture.
The portal includes several enhancements over the standard Tableau interface, such as additional buttons for exporting data and dynamic filters that adjust content based on user selection, like filtering by store. These features are integrated into a custom navigation framework that complements the analytical tools provided by Tableau.
One crucial design decision in creating custom portals is determining the balance between customization and using built-in Tableau functionalities. For instance, choosing where to place filters—within the Tableau dashboard or as part of the external web interface—can impact both user experience and the portal’s long-term maintainability. Each option has its merits, but the right choice depends on the organization’s specific needs and strategic goals.
Custom Facing Products
Customer-facing products that incorporate analytics directly into their interfaces are becoming increasingly common, particularly in industries where data-driven insights are essential for user engagement and product functionality. Like custom web portals, these products often integrate Tableau to enhance their analytics capabilities, offering end-users a seamless and tailored analytical experience. This approach is exemplified by products like Fitbit, where users regularly interact with charts, visualizations, and trends directly within the app.
The primary benefits of using Tableau for customer-facing products are akin to those observed with custom portals: the ability to create a completely white-labeled, seamless integration that accelerates development timelines and significantly reduces ongoing maintenance costs. These advantages make Tableau an appealing choice for businesses looking to enhance their products with robust, integrated analytics without the need for extensive development resources.
An example provided during the discussion is Cumulus Bank’s finance application, developed using Tableau. This application showcases a variety of embedded dashboards right on the front landing page, offering snapshots of different analytical views.
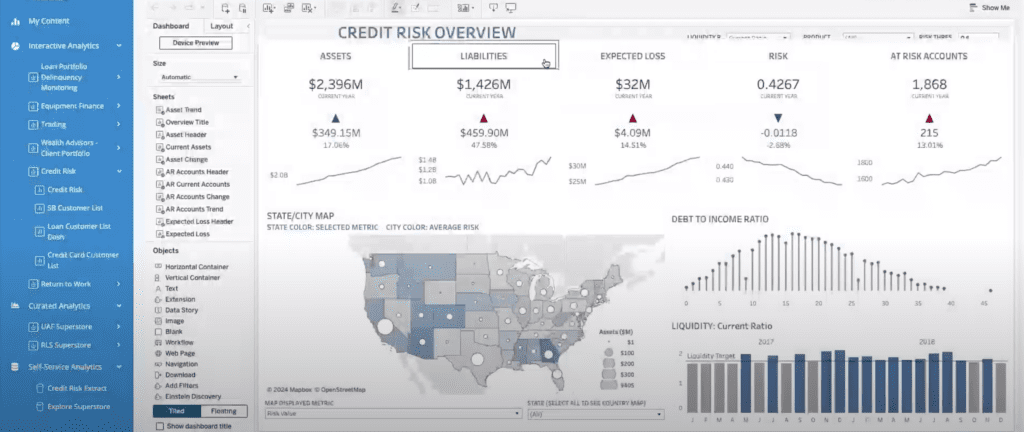
This design allows users to quickly access the specific insights they need without navigating away from the main interface. Moreover, the application leverages the Tableau API to enable the dynamic addition of new dashboards and features, demonstrating Tableau’s flexibility and power in customizing user interactions.
A particularly innovative aspect of this integration is including advanced features such as dashboard editing within the product interface itself. This functionality enhances the user experience by allowing personalized interaction with the analytics and opens up opportunities for upselling additional features. For instance, users might be offered the capability to create or modify dashboards as a premium service, adding value to the customer experience and generating additional revenue streams for the provider.
Conclusion: Embedded Strategy with Tableau
The presentation explored five high-level use cases for embedded analytics, each demonstrating the diverse applications and strategic benefits of integrating Tableau into various business environments. From simple web pages to complex customer-facing products, the flexibility and robust functionality of Tableau facilitate a range of analytical solutions tailored to meet specific organizational needs.
When developing an embedded analytics strategy, it is crucial to take a step back and carefully consider several key factors:
- User identification and use case definition: understanding who the end-users are and defining the specific use cases are critical first steps. This helps in tailoring the analytics to meet the exact needs of the users, enhancing both the effectiveness and the user engagement with the analytical tools.
- Customization and maintenance: determine the level of customization required and assess the maintenance efforts needed to support it. Organizations need to consider whether they have the necessary expertise in-house or if they need to engage a third-party service provider. This decision will significantly impact both the initial deployment and long-term sustainability of the analytics solution.
- Hosting options: deciding whether to host Tableau on-premises or in the cloud is another essential consideration. Each option offers different benefits and challenges, particularly in terms of scalability, maintenance, and cost.
- Security: the foremost consideration in any analytics implementation, especially in embedded analytics, is security. Ensuring the protection of data and reports is paramount, as this not only affects compliance and trust but also the overall integrity of the analytical system.
The discussion provided a comprehensive overview of how to strategically implement embedded analytics, highlighting the importance of customization, user-centric design, and security. By carefully considering these elements, organizations can effectively integrate Tableau to enhance their products and services, driving better decision-making and offering a competitive edge in their respective markets.
Transcript
>> SEAN O’CONNELL: Good morning, everybody. Good afternoon to others. My name is Sean O’Connell, and I’m a senior manager here at Tableau. I’ve been with Tableau for about six years now. Throughout my career, a lot of my success has come from working with organizations who were leveraging embedded analytics. Can everybody else hear me?
>> CHRIS MONAHON: Yes, we can.
>> STUART TINSLEY: We can.
>> CHRIS MONAHON: We can, yes.
>> STUART TINSLEY: Yes.
>> SEAN O’CONNELL: Okay. Cool. A lot of my success has come from working with organizations who are leveraging embedded analytics, which is probably why they asked me to help lead today’s discussion. What is Embedded Analytics? Tableau Embedded Analytics enables your organization to embed and customize interactive analytical capabilities to create a seamless experience within your products, applications, websites, and more.
Typically, there’s four key drivers behind why organizations leverage Embedded Analytics. The first being to unlock new revenue streams by monetizing your data. The second is elevating customer experience with unique self-service and personalized analytics. The third, differentiating your organization’s services or offerings compared to the competition. Then lastly, and most commonly is just bringing the insights to where your users are, avoiding the need to hop back and forth from workflow to analytics and back.
Whether you’re looking to accomplish one, two, three, or all four of these goals, Tableau can be the perfect partner to enable your organization to achieve success at scale. I’m going to turn it over now to one of our top premier partners, XeoMatrix, to walk us through the rest of today’s presentation. I’d like to introduce Chris Monahon, the CEO of XeoMatrix, as well as Stuart Tinsley, the director of Sales and Client Success. Take it away, Stuart.
>> STUART TINSLEY: Awesome. Thank you, Sean. Hi, everyone. I see a lot of familiar faces today from our data-driven community, so good to see you all, and everyone else. Great to meet you. Today, we’re going to talk everything Embedded. I’ve been in the Tableau platform for about 10 years. I used to work at Tableau. I love talking about Embedded Analytics. It’s a use case that we’ve seen come up so often in the last couple of years. Hopefully, by end of session, you have a better foundation of what Embedded Analytics is, how you can deploy that. Chris has some really awesome demos that he’s going to walk through today. Chris, we can go two slides forward. Awesome.
For anyone on the call that isn’t familiar with Embedded Analytics, this slide will hopefully cover that. Sean alluded to this a minute ago. Embedded Analytics is simply the integration of analytics tools and capabilities within other software applications. The goal is simply to provide users with access to real-time insight and data-driven decision-making capabilities within the context of the applications that people use on a daily basis. Chris, we can go to the next slide. Awesome.
Who is buying Embedded Analytics? We see very typically three different scenarios. The number one are your external portal scenarios. Think about companies who are sharing data with their partners, with their customers, with suppliers, franchisees. The second is a solution provider. These are companies, typically software companies that are integrating data within their own product or service. The third scenario are information providers. Companies that are selling insights and data as an analytic service. We’ve included some logos there of different examples.
Why Embedded Analytics? First of all, there’s a substantial value that you can have for your business if you offer Embedded Analytics. You can increase engagement with your customers. You can add additional revenue streams by offering insights to customers. You can also refine and uplift your competitive edge in the market. It’s also a substantial value for your customers. You’re giving them self-service analytics where they can gain actionable insights, and they can look at rich and engaging content.
Why Tableau? If you’re familiar with Tableau, you know that the learning curve is not steep. You can build dashboards in hours, not days. It’s one of the easiest platforms to customize and to integrate. It can also scale flexibly and securely. What we’ve heard from customers over the years, what they needed with Embedded Analytics. First of all, they wanted to be able to streamline their external reporting, and build better relationships with their customers and their partners. They wanted to be able to quickly integrate Tableau, build custom dashboards that were ready to be accessible via their customers. They wanted to create a new level of engagement and interactivity with their customers. They wanted to uplift their brand. All of them are often very concerned about security. They want security to be at the forefront of these deployments with Embedded. Chris, we can go to the next slide.
As you’re thinking about Embedded Analytics, you look at two different scenarios. You either build it or you buy it. There are a couple of key criteria to consider. That would be time to market, scalability and flexibility, the core expertise that your team has, the resource allocation, the maintenance updates, and the overall customer experience. If you go the path of building an embedded solution, you can almost inherently expect a longer development time, and one that requires more resources, and most certainly more maintenance that will be required.
If you buy, you can expect a quicker time to market, a better customer experience, and less maintenance costs. We want to include a slide here about a company called IDBS. What they do is they help researchers quickly spot data anomalies and outliers that can lead to major scientific breakthroughs. With Tableau, they brought their embedded solution to market in three months. They were able to create intuitive Ambedded Analytics that empower R&D organizations all over the globe with real-time self-service analytics. They could unleash the power of scientific data, which makes a direct impact on all laboratories that use IDBS solutions. This is an example here of Tableau embedded into their application.
Awesome. I want to turn it to Chris at this point. He’s got some really awesome demos that show the art of the possible with embedding and lots of very helpful context. Chris, I will pass it to you.
>> CHRIS MONAHON: All right. Thank you, Stuart. Hello, everybody. My name is Chris Monahon. I’m president of XeoMatrix. I am based here in Austin, Texas. I’ve been doing data analytics for about 20 plus years. I’ve got a lot of experience in the industry. In my earlier in my career, I was a web developer. I really enjoy advising clients on different embedded strategies and just learning all the different things and ideas they have on how to deliver analytics to either their customers or their partners. It’s something I’m really passionate about.
A little bit about our firm. We are a Tableau Gold Partner. We’re headquartered here in Austin. We are very active in the Tableau community. We sponsor the Austin TUG here. We like helping organizations with the deployment, training, and adoption of Tableau. That’s what we do. We are a full-service shop, but when it comes to Embedded Analytics, we’ve sort of carved out a niche in advising clients on the best way to build highly scalable solutions using Tableau.
Today, what I want to talk to you about is how to craft an embedded strategy. As Stuart said, I’m going to be sort of painting the art of possible, showing you a couple of demos, and just explaining some of the different options you have when you’re trying to embed. I guess when we talk about Embedded, Stuart gave a couple of examples, but we want to define first, what is embedding? Frankly, it could be anything. You can embed into a portal, into a custom application, into just a simple webpage. It could be internal or external. There are multiple, many different use cases you can do with Embedded.
We’re going to cover all those today and see which one sort of best fits maybe your organization. That’ll help you. I’ll give you all the information you need to craft that embedded strategy that we talked about.
There are basically several different types of implementation options you can have. I’ll review these five today. One is a simple webpage. Embedding Tableau in a simple webpage. I’ll show how easy that is with a couple of clicks. You can also embed in third-party applications. You can have Tableau Out-of-the-Box, which I’ll show you as well. Then there’s some custom web portals and applications which we’ll cover as well.
When you’re talking about Embedded and trying to plan a strategy for your organization, there’s a lot of different factors you need to consider. First of all, you need to identify who are your end users? Who are you going to be delivering analytics to? Because you need to identify that use case. What type of analytics are you going to be delivering? What type of security is required?
Also, is this an internal or external use cases? Embedded isn’t always external, it can be internal as well. Those are some of the things you need to consider. Is this going to be a custom solution? If so, is that going to be fully branded or white-labeled? All this comes into play because you need to understand how much development is going to be required to bring your solution to launch. You need to determine then, is that something that we want to then support internally or do we need some assistance like a third-party consulting firm or maybe some other department to help you with that type of development?
All that plays because you need to understand what are your future maintenance and support for it. Another thing to consider too is, is this going to be hosted in Tableau? Are you going to be using Tableau On-prem or Tableau Cloud? We’ll touch on that and some of the options you have there. Lastly, security is first and foremost when it comes to doing Embedded Analytics. You always need to understand sort of what are the security requirements from an authentication standpoint, getting into the portal itself, what permissions you have as far as the content people are allowed to see.
Lastly, road level security, what kind of data is the user allowed to have access to? Security is one of the number one considerations we always discuss upfront when we talk about Embedded Analytics. We’ll cover that a little bit as well. What are the different methods for embedding? Let’s just cover that real quick. Some of you guys might not be programmers, I understand that, but at a high level, there’s really just two simple ways to embed a Tableau dashboard inside a portal or a webpage. There’s a simple embed code, which is simply just little HTML tags that you can copy and paste with a couple of clicks into a webpage or you can do API coding.
This is where you really leverage Tableau’s robust embedded API to do a lot of the programming. That does require some programming skillsets. The difference is embed code, it’s quick, it’s easy to set up. There’s no maintenance of the code. It’s real simple to implement. However, you can’t really customize it as much as you would want to. If you’re going to do something that’s a little more white-labeled, you would use API coding, and programmatically tailor or customize the interface as you see fit to integrate Tableau.
The second is, I discussed, when you’re going to deploy Tableau Embedded Analytics, you have a couple options too of where Tableau actually resides. There’s two options with Tableau. You have Tableau Cloud and Tableau Server. Both are great options. Tableau Cloud is fully hosted. Obviously, there’s no maintenance required with that. I would say probably 90% of our clients are on or have moved to Tableau Cloud. That’s the most popular choice. Sometimes, there are some security reasons that people want to have their own hosted version of Tableau Server, which is also good as well. If you have strict data requirements, you might consider that as well. I would say most of our clients are now moving to Tableau Cloud when they’re doing Embedded Analytics.
When we’re talking about Tableau, the licensing considerations are something to discuss as well and to understand fully. When you’re going to do a deployment, it’s important to understand how many users you’re going to be deploying Tableau to. That can help factor into maybe your decision on the licensing model you want to adopt. There’s two types of licensing models. You have your named user licensing, and your usage-based licensing. Named user is obviously, as it says, you’re having dedicated seat licenses. You have a known number of users and you know who’s going to use it. If it’s very predictable, you know what the usage is going to be, you would want to do something more like a named user license.
On the usage-based licensing, that’s when you have maybe a large number of users, but there’s light usage or infrequent usage. Imagine if you had– you’re going to deploy this to 10,000 users, and maybe only 1,000 of them are actively logging in, you could do this on the fly and have usage-based licensing. The important thing to understand is that you’re being charged based on the number of impressions or views of the dashboard. That’s a slightly different model than named user licensing. Both are great options. When we meet with clients, we help advise them on the different licensing models that work best for them. Just wanted to cover that as well.
Now, let’s get to some demos. The first example I want to talk about is simple webpages. If I have Tableau and I want to embed it maybe in a public-facing dashboard or website, that’s very simple to do. You see that a lot in the public sector, especially. I know during the pandemic, a lot of states had public-facing dashboards with Tableau out on their websites, which was great to see and very helpful to the community.
Here’s an example of Redfin. They’ve gone ahead and embedded Tableau straight into their website. People can analyze their real estate data and see all the different trends in the real estate market. The advantage of using an embed code to do something like embed in a simple webpage is that it’s, again, extremely easy to set up. There’s no real portal development needed. You just have a simple website, and pop the code in.
One thing to note, though, is that security may be required to authenticate into Tableau if you are using maybe not a public-facing version of Tableau. If it’s your own version, you might still have to have a sign-in. That’s just the only thing to consider. Other than that, it’s very seamless. Let me go ahead and show you an example of this.
Here, as I mentioned, here’s Redfin’s website. You can see how they’ve embedded Tableau straight into the webpage. It looks pretty slick. The way they did this is that if you go to the Share button, there’s the simple embed code there, and they just pop it straight into their webpage. This allows any people that are looking at the website to analyze the different trends right here within the confines of the Redfin website.
I went ahead and created a quick little demo on Wix. It’s just a free website creator. I wanted to show how easy it is to do something like this. I went ahead and created Hightech. It’s a new Hightech company, I guess. I went ahead and created a new webpage. Without getting into the details of how Wix works and how you set up webpages and things like that, what I did was I used Tableau’s embed code to embed a nice-looking dashboard here in the website.
This is a Salesforce Opportunity Tracker. In fact, I think Stuart created this one. The way we went ahead and did that, if you go ahead and look in our Tableau online site, in Tableau Cloud, you can see here that we have the dashboard here. In order to go ahead and embed this, all you have to do is click on Share, copy the embed code, and come back to the Wix editor here. Then you can simply edit the code. You just cut and paste the code straight there. That’s it. That’s all you have to do. It’s that easy to do embed code. That’s why this is very popular to do. We see this done a lot of times, especially if it’s like a beta version of your web, maybe a portal you’re trying to get off the ground. Embedding is a good way to do that.
Now, one interesting thing, too, is that– when people think of Embedded, they always think about Tableau dashboards. It’s a new world, and everyone’s moving to AI. One of the new use cases we’re seeing is that people are embedding Tableau Pulse into portals. It’s a very cool use case. For those that aren’t familiar with Tableau Pulse, it’s a new feature in Tableau. This is the digest here. What it does is it uses AI to show your different trends. You can see here is a summary of my metrics that’s produced by AI. Then down below, it shows different metrics that I’m following. If I want to, for example, drill down onto profit, I can click down on profit. Then it brings up different trends that are called out here.
Now, I can also go ahead and filter this by clicking on different filters here. I can break this down by customer name. I can slice and dice this all right here. Again, using generative AI, Tableau Pulse is going to go ahead and search all my data and surface the questions that are important to me that I might– or suggest questions that I might want to ask next. For example, it recommended that maybe I should look into which customer name decreased the most. With a single click, I can go ahead and get that analysis right there at my fingertips. This is a very cool feature and a very good use case of using it in a portal. We’re seeing a lot more of that instead of just doing dashboards.
Let’s go ahead and go to our next use case here. We’ll talk about third-party applications. Third-party applications, you can think of a lot of internal use cases for this like Wikis or internal portal, intranets. One very popular one is SharePoint. Integration with SharePoint is very easy to do. The reason a lot of people use this as Embedded use case is because a lot of your users are already familiar with going to the Wiki, “Let’s go ahead and embed Tableau there rather than having them go to Tableau.” By putting your dashboard straight into SharePoint, for example, you’re making it real easy, and Tableau very accessible to your end users.
Again, there’s no coding involved. It can use just simple embed code. Since with something like SharePoint, it can integrate easily using Active Directory or some sort of single sign-on option.
Let me go ahead and show what that looks like. Here’s my SharePoint portal. Here, you can see I have this nice dashboard embedded here. The way I did that was I took the dashboard here. Again, with a single click, I just went ahead and copied this URL here. Then I can come here and edit the webpage that we have. Let me go ahead, edit this. Then again, similar to what we did on our website there, we can go ahead and edit this webpage and pull up the embed code. One second here. We can go ahead and add the URL as well. Right there.
In our embed code, we’ll go ahead and add the URL. It’s as easy as that. A little cut and paste, no coding required. For you that aren’t very technical, again, this is very easy to do. Hopefully, I’m showing you guys how easy it is to integrate Tableau into any of your applications.
Let’s look at a couple other examples here. The next very, very popular integration that we have is how do you embed Tableau in Salesforce? Now, of course, everybody knows that Salesforce and Tableau– Tableau is owned by Salesforce. They have a very tight integration here. Again, it’s just a few clicks and real easy to do. The main reason we see a lot of people embed Tableau in Salesforce, directly in Salesforce, because a lot of their end users want to be able to access and do analysis right there without leaving Salesforce. With a couple of clicks, you can drill down on accounts and see dashboards based on that particular customer or client or that product that you’re interested in analyzing right there without leaving Salesforce. Again, no coding necessary.
In this case, instead of using an embed code, we’re going to use what they call the Tableau Viz Lightening component. It’s integrated straight into Salesforce. It allows you to drag objects on and off the page. Then you can map it and filter by different Salesforce objects like account or contact. Again, all this works with Active Directory or maybe Salesforce MFA. Any sort of single sign-on can be leveraged to do that integration. What I wanna show you here, also works for Salesforce Community Cloud. Let me go ahead and show you how that works.
Here, you can see we have– this is the Tableau Viz Lightening web component. I’ll send out these URLs after the webinar. It’s real easy to install. In fact, it’s Out-of-the-Box now. There’s tons of documentation on how this works, how to integrate single sign-on, things like that. At a high level, we have this dashboard here. This is the dashboard we built in our demo Tableau Cloud site. You can see here– Whoops. Let me go ahead and reconnect. It’s like a timed-out here.
What we have here is that we have a filter here. The filter is based on customer. We have a filter based on customer. That’s very important because in a second here, we’re going to leverage that as a filter in Salesforce. Here, you can see I have a bunch of different accounts that we have. Let’s click on Ace Electronics. What I’m going to do is I’m going to edit the page here. I’m going to show you how easy it is to pull in the Tableau Lightening component and do the integration. If you scroll down on the left here, you can see there’s this Tableau View component. I’m going to go ahead and drag and drop that here right under– let’s say right under Quick Links.
The next thing I can do is I can grab that URL that I have, and I can cut and paste that right here, straight into the parameter components here. All these little parameters are used to configure the Lightening component. I’ll go ahead and I’ll make this– Let’s make the height a little taller here. Then what we want to do is we want to now filter on a record ID. We want this dashboard to filter only for Ace Electronics. I’ll click this button here. I’ll say that the customer name is going to map to the Salesforce account name. We’ll do something like that. Right now, you can see this will filter just to Ace Electronics. Let me go ahead and save that. Then we’ll go back and exit.
Now, what we have is our dashboard filtered just by Ace Electronics. If I go back and I click on, for example, Acme Corporation, which is a very popular company, we’ll see here that now, I’m filtering just by Acme Corporation. Again, without any real coding, I’m able to integrate into Salesforce seamlessly, and really allow our salesreps, anybody on support to be able to access the dashboards they need without leaving Salesforce.
Let’s go ahead and talk about our next use case. When we talk about Embedded Analytics, sometimes we don’t talk about leveraging what we already have, and that’s Tableau Out-of-the-Box Tableau Out-of-the-Box, in a sense, is a portal. We find that we have several clients that actually provide Tableau Out-of-the-Box to their end clients to allow them to do analysis. The reason being is that it’s a very familiar experience for many users. It’s, obviously, can lead to faster adoption because a lot of their clients or partners are already familiar with how to use Tableau, and they really have confidence in the analytics that they’re providing because they know that it’s powered by a great brand like Tableau, and the platform in itself speaks for itself.
We see this done a lot. Again, there’s no development obviously required, and all the maintenance and stuff is maintained by Tableau, especially if you’re using Tableau Cloud. This is a very popular use case. And for those that maybe are new to Tableau, I can show you what Tableau Out-of-the-Box looks like. This is the landing page when you first log in. It shows all the hierarchies that– these are called projects or folders. Any of this, if you want to build your own portal, obviously, would require some development, additional coding to build this in, but you get all this out-of-the-box. Here, we can go ahead and click on dashboards, and then we can get all the analytics we need right here right out-of-the-box without any coding. Again, this is a very popular option that we see for people that maybe want to just leverage Tableau.
Let’s go ahead and talk about Custom Web Portals. Now, this is really when we talk about Embedded Analytics, what people are really, really talking about. They want to see a fully customized experience. We advise a lot of clients on how to go about doing this. Again, this is different than the other examples we showed. It’s not going to be a simple click and use embed code. It does require some programming, but the end result is that you get something that’s very white-labeled, very custom. In fact, a lot of people don’t even know it’s Tableau. It’s a very popular use case. You can scale this to thousands of users.
Again, I think the reason a lot of people do this is because they want to present a very white-labeled experience to their clients or to their partners, and they want to make it seamless. With a custom solution like this, when you log into the portal, you seamlessly log into Tableau. There’s no indication that you’re even using Tableau. A real popular reason we see people leverage the Tableau platform is because it’s going to accelerate your development. This goes back to Stuart’s earlier comments around build versus buy.
If you’re trying to build your own solution with custom visualizations or the drill-down folder hierarchies and all that, that’s a lot of work. What we find is most clients, when they’re using Tableau, they get about a 30%– they can bring their product to market about 30% faster than if they tried to build it themselves. That’s a huge saving. Sometimes, we’ve seen it higher than that. The accelerated development and lower cost of maintenance is the main reason we see people go with a custom solution.
There also is some web edit capabilities which you can go ahead and upsell or monetize. What we’ve seen is that there’s several different tiers with a custom solution that people offer to their clients. Maybe basic dashboard viewing is the first tier. Then there’s certain subject areas that you might monetize, access to certain dashboards, or you can also upsell by saying you can now create your own reports within the portal. All that is very common what we see with these types of solutions.
Let me go ahead and show you what this looks like. Here’s an example. If you go to our website, we have some demos that show the paint the art of the possible. Here’s one that’s the franchisee portal. I’ll go ahead and pull that in. With this solution, we’ve gone ahead and provided two different logins. John Smith is going to be your store manager in this use case. Then we have Julie Evans, which is your regional manager. I’ll go ahead and log in as Julie Evans.
When I log in, you’ll see that we have this great space here. This is going to be Tableau. This is going to be your dashboard. Everything else, this is considered the portal, the wrapper. This blue bar up at the top, the black navigation on the left, all that is customization. For those that are a little techie, this is using a React front end. It’s very easy to customize for developers that know some sort of JavaScript. They can go ahead and use the embedded API to build something like this. We usually say a prototype like this can be built out in half a day to a day. That’s how quickly you can build things out with Tableau’s architecture.
Now, with this portal, you can see here that we’ve gone ahead and customized a lot of things. We’ve added maybe some buttons here to do exporting to PDF or CSV. In addition, we’ve gone ahead and added some filtering capabilities. We added filters here on the left. You can filter by store. You can change the views and have different dashboards as well. Again, we’re leveraging Tableau to provide the analytics. Then we’re just simply building a custom portal to handle the navigation and the filtering.
Now, there is something I want to comment on, and this is a design decision. If you are going to go down the custom portal route, one is it– how much do you customize from a white-labeling sort of standpoint, and how much do you allow Tableau to do? For example, we go ahead, we have the filtering dropdown menu here to filter by store. We could have easily moved that into the dashboard itself. There’s some advantages to that. Now, you don’t have to go back to your development team every time you want to go ahead and maybe add different filters. In some cases, you might want that more custom filtering experience. You might want to push it out into the web development. It’s all up to you, but you just need to weigh the maintenance cost of what it is to maintain that code moving forward.
This is a great example of how we use portals. This is another example here, an [inaudible], a broker portal. Just a different layout. Again, all this is going to be Tableau. We are going to use filters, use the API. Whoops. Use the API to go ahead and filter on the left– to filter the dashboard down below.
Let me go ahead, and we will touch on our last use case here. This is customer-facing products. Again, similar to portals, customer-facing products or applications need analytics, sort of your Fitbits, things like that. If you’re logging in, you always see charts, visualizations, trends. That’s very common. We get a lot of organizations that have a product and want to build Tableau to power their analytics in their product.
Again, it has the same sort of advantages that you would see with a custom portal. It’s going to be a completely customized experience, white-labeled, seamless, integration and login with Tableau. It’s going to accelerate their development and lower your maintenance costs. That’s the most important thing.
Let’s go ahead and look at an example. This is one that Tableau built. This is their embedded dashboard portal here. They have one that is the– it’s a finance application. It’s Cumulus Bank. What I want to show you here is just a different style of a different approach in embedding Tableau. Here, you can see they’ve actually embedded different dashboards on the front landing page. Just little screenshots of the dashboards themselves.
Now, again, using, and this is the art of the possible, you can go ahead and add additional ones. You can see here, now I have the executive dashboard that I added there. This is very cool. Again, this just shows the power of the Tableau API. You can go ahead and, really, any sort of experience you want to do, you can embed right there in your portal or your application.
Now, if I want to go ahead and look at some different reports here, I can drill down on the left hierarchy here, and I can see credit risk. Let’s pull up credit risk. You see here, I can instantly get the insights I need. Now, the nice thing about this is they’ve gone ahead and added some additional features. You can see, we can filter, we can download, but they added another capability here which is editing the dashboard. When we talked about adding some upsell features or monetizing your product, your platform, this allows you to edit the Tableau dashboard right here within the portal. It’s a very cool use case, and it’s something that we see a lot more common nowadays as well.
To wrap things up, those are the five different high-level use cases that we’ve seen. Hopefully, I gave you a lot of information on how to craft a strategy and find out which one maybe fits best for your organization. I would say, when you’re sitting down and trying to come up with your embedded strategy, again, step back and identify, number one, who are your users and what is the use case. Then secondly, determine how much customization or maintenance you want to take on, and how are you going to go about doing that? Do you have that knowledge in-house or do you need a third party?
Lastly, think about how you’re going to host Tableau. Is it going to be on-prem or in the cloud? The number one thing to consider always with Embedded is how to secure your data and your reports. I’ll leave you with that. Stuart, I will then turn it over to you for any Q&A. Oh, one last thing as well. We are offering two hours of consultation. If you guys do have questions, please feel free to reach out. Happy to chat with you guys about any questions you have regarding your particular use case. We can just talk about some of the options that might work best for you. Stuart, turning it over to you.
>> STUART TINSLEY: Cool. All right. I got one question that came in. Please use the chat window right now with any questions that you have. Someone asked about the licensing requirements to use Tableau to embed analytics on a website. That’s a really good question. It goes back to what Chris was talking about. If you have a report that doesn’t have sensitive data, so therefore it could be on Tableau Public, you wouldn’t have to have any license for that. If your data is sensitive and need to be restricted, then you would need to have appropriate licenses from Tableau to handle that. That was a good question that came in. Let’s see.
Another question, Chris, that came in, this might be for you. “How would login credentials pass through when embedding a dashboard to a webpage?”
>> CHRIS MONAHON: That’s a good one. There’s two approaches to that. One might be, again, if you’re using single sign-on, your portal, if you have some sort of Okta or something like that, you can configure both your portal and Tableau with Okta. That user experience, I would say, isn’t optimal because you might see the Okta spin when it shows your dashboard. What is the preferred approach to do it is to use something called connected apps. I’ll send out these links as well. We’re trying to do too much a tech deep dive here, but there’s a great blog post on the Tableau website called Connected Apps Tutorial. You can Google it. It really steps you through the process of how it works.
Essentially, you’re setting up a trust between your application or your portal and Tableau. That’s called a connected app. The connected app specifies– it basically gives you a secret token, information that it gives to you. That information will allow you to create a token on behalf of the user. This JWT, this JSON Web Token is what’s used to go ahead and pass information to create that session. That is then redeemed by the user to show the dashboard. It’s not as hard as it might sound. Here’s some code on generating the JSON Web Token. You pass a secret and everything like that.
It looks a little bit like this. You can see, it’s got some information. A little bit of coding here. Then it has the username, and then it opens up a session. The nice thing about this is you can also implement row-level security using this JSON Web Token. This JWT, you feed in different type. Let’s say you want to secure by client ID, there’s a feature called User Attributes which will allow you to pass these filter information through the web versus handling it in Tableau. It’s a little more high level than we were going to do in the webinar, but a little bit more detail to cover in this webinar, but happy to talk about it offline.
>> STUART TINSLEY: Another question that came in was around the timeframe to deploy Embedded Analytics. Chris, is there an average that it takes to get off the ground and running in terms of maybe weeks or months?
>> CHRIS MONAHON: That’s a great question. Yes, I would say– like I said, a proof of concept, you can get spun up in like a day or so. That’s not hard. Just an easy proof of concept. To productionize it, we’ve seen it anywhere from a couple of weeks to a couple of months. What usually is the long tail, I would say, is the design. If you have a design in mind, it’s a lot easier upfront. Then also sourcing the data. The actual dashboarding part of it tends to be a little bit longer, but the actual customization, like building the portal itself, is pretty quick. It can be, like I said, usually a couple of weeks. We offer a custom portal ourselves, which is sort of a jumpstart that can get you going in a couple of weeks with the dashboard. That’s also another option.
>> STUART TINSLEY: Another question that came in, “What if we don’t have a portal?”
>> CHRIS MONAHON: That is a little bit trickier. We do get some folks that only have a website, they don’t have a portal. As I mentioned, there are some third-party portals out on the market that you could purchase or integrate with. More commonly, we offer our own portal and help build out that custom solution for you. It’s real quick to do. It sort of jumpstarts your deployment. As I mentioned, that takes roughly two weeks to turn out. It’s pretty easy.
>> STUART TINSLEY: That is great. I think, Chris, that’s all the questions that we had come in. Anyone else have any other questions? These are good.
>> CHRIS MONAHON: Good questions. All right. I do appreciate everyone’s time. Again, if you have any questions, please feel free to reach out. I hope you guys enjoy the rest of your day. Take care.
>> STUART TINSLEY: Thank you, Chris. Thank you, everyone.
[] [END OF AUDIO]
