A year-over-year analysis is essential for businesses to track their performance and identify trends. Businesses can gain insights into their growth, revenue, and other key metrics by comparing the current period with the previous period. Tableau is a powerful data visualization tool that can help you create interactive dashboards and reports for your year-over-year analysis.
In this guide, we will show you how to define the period of time you want to analyze, and how to create calculations for current and prior period sales.
Understanding Year-over-Year Calculations in Tableau
A year-over-year calculation is an analytical method that compares the performance of a specific metric in a current year to the same metric in a previous year. This calculation is particularly useful in identifying trends and patterns over time and evaluating the success of a business or organization. By comparing data from one year to another, you can determine if there has been any improvement or decline in performance and can make data-driven decisions based on these insights.
In Tableau, this calculation is straightforward and easy to implement, making it a valuable tool for any data analyst or business intelligence professional.
Tutorial Video
How to Build Year-over-Year Calculations in Tableau
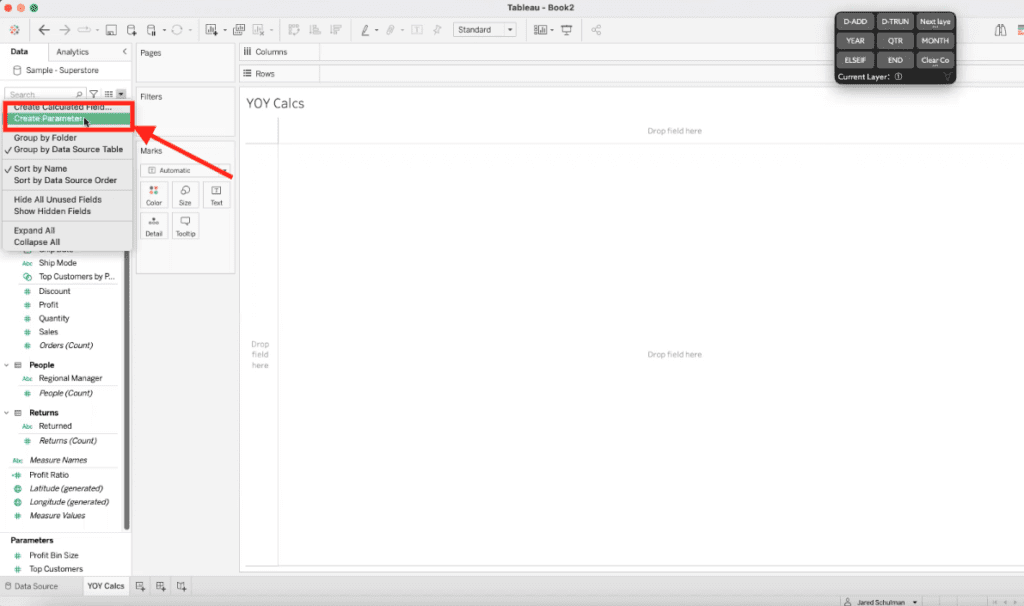
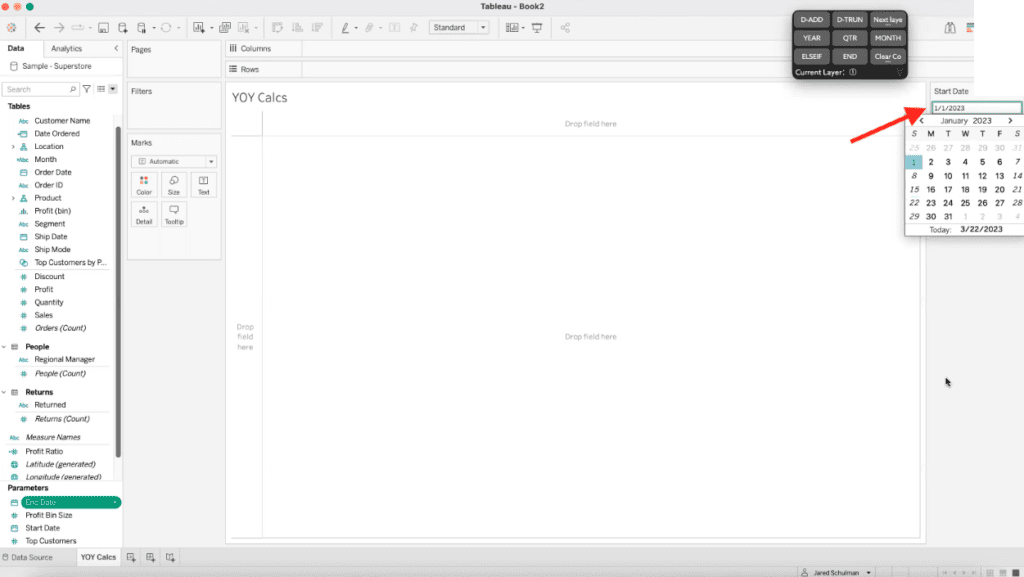
1. Create the “Start Date” and “End Date” Parameters
Our first step is to create the parameters for the “Start Date” and the “End Date.”
To create these parameters, click the “Create Parameter” button.
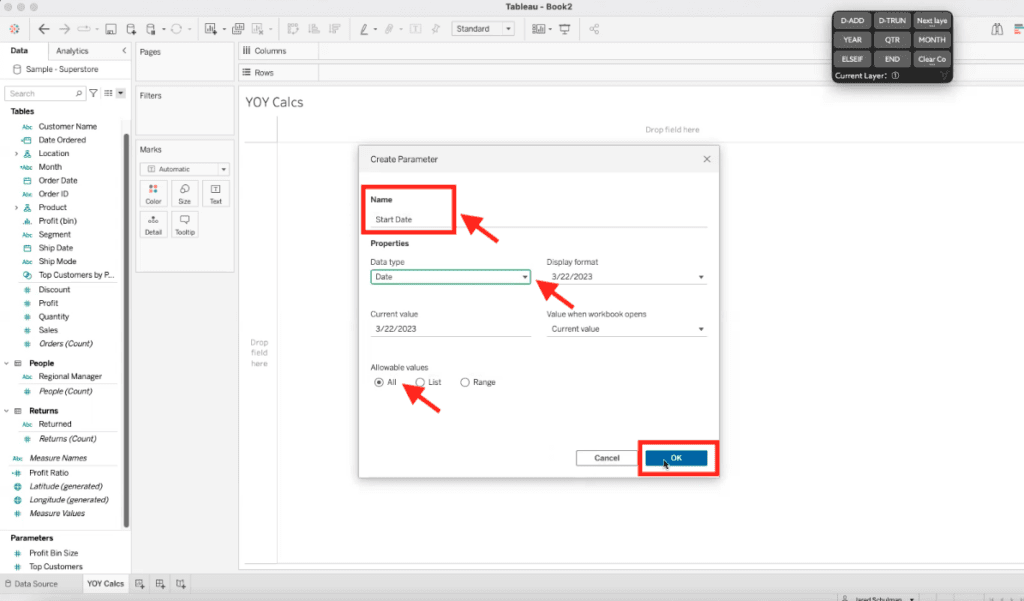
This will bring out a pop-up, and we’ll populate the Name parameter with “Start Date.” Select “Date” under the Data type drop-down menu and set the allowable values to “All.” Click “Ok.”
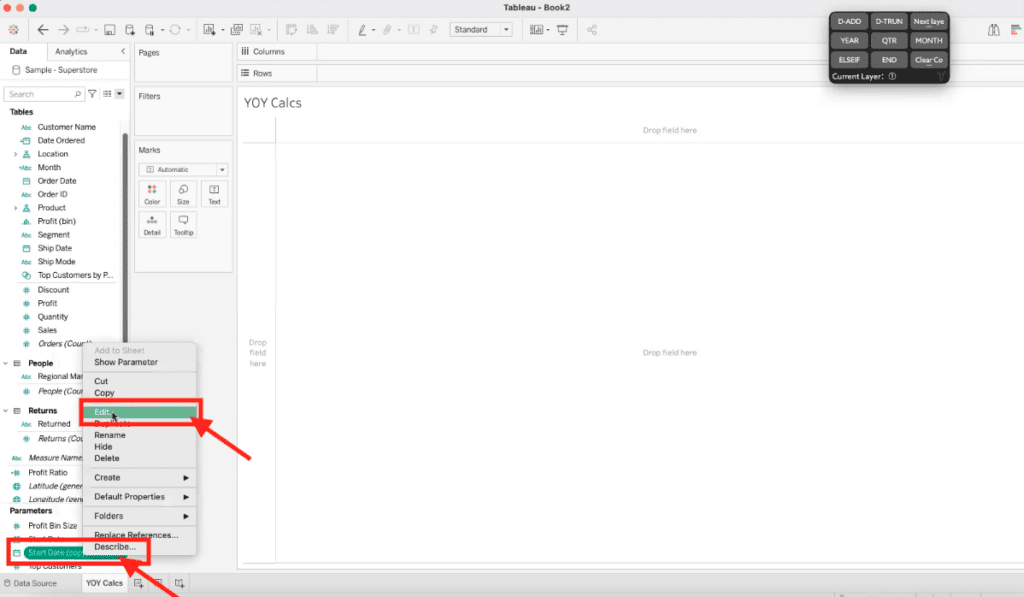
Then, duplicate this parameter by right-clicking it and selecting “Duplicate.”
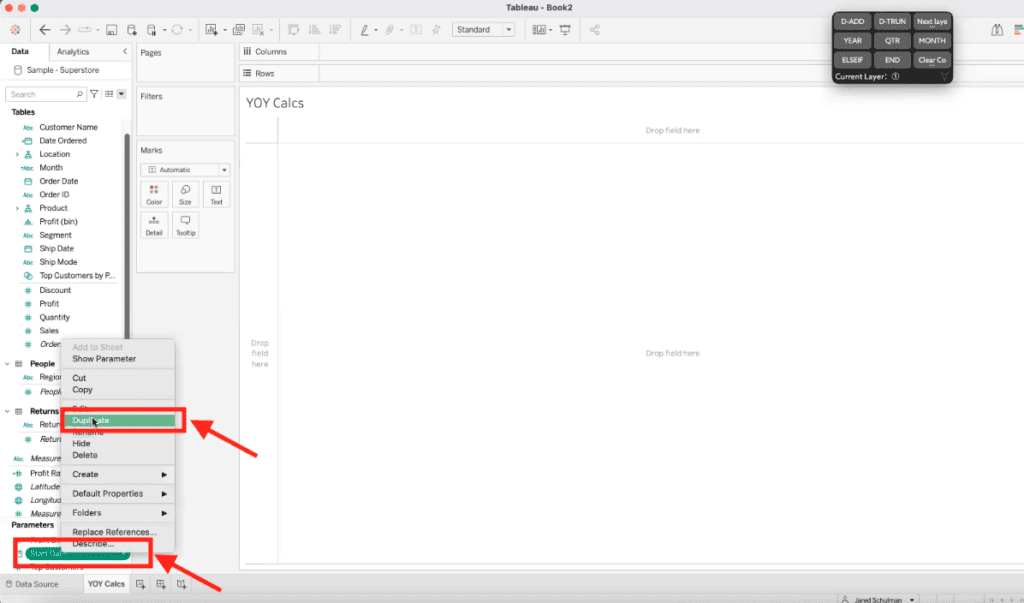
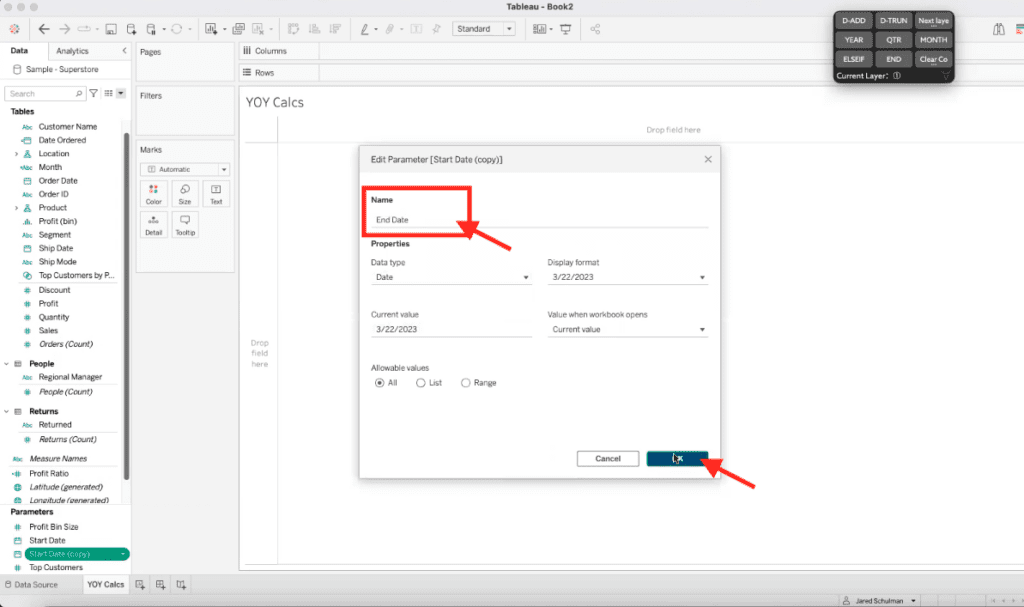
Now, we are going to edit the duplicated parameter by right-clicking it and selecting “Edit.” Then, we are going to edit the Name to “End Date” and click “Ok.”
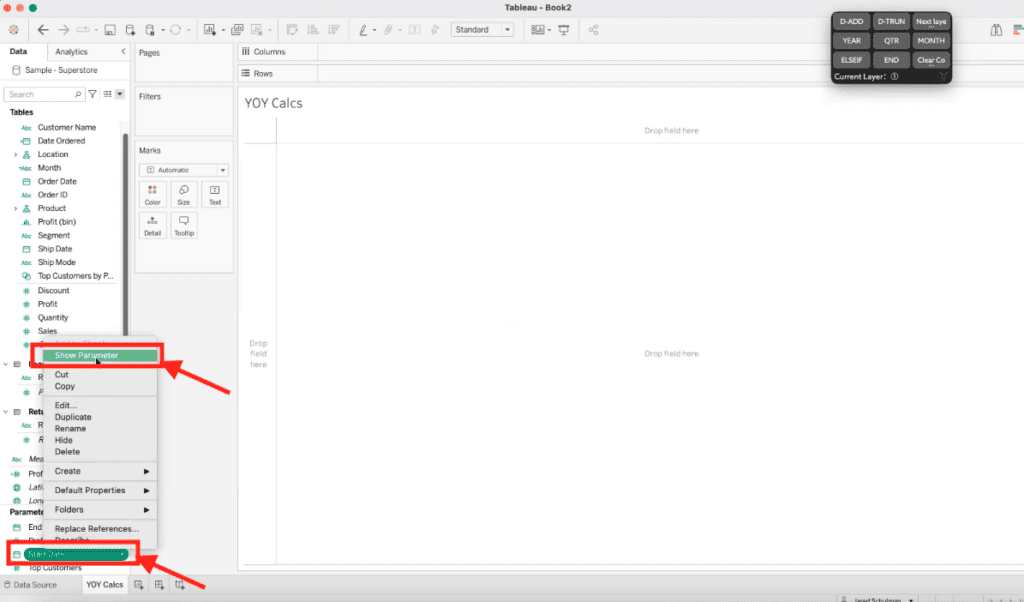
To have a clearer visualization, we’ll move the new parameters to the right-hand column. We can easily do this by right-clicking the parameter and selecting “Show Parameter.” Perform this step with both “Start Date” and “End Date.”
Now we have our Date parameters on the right-hand side column.
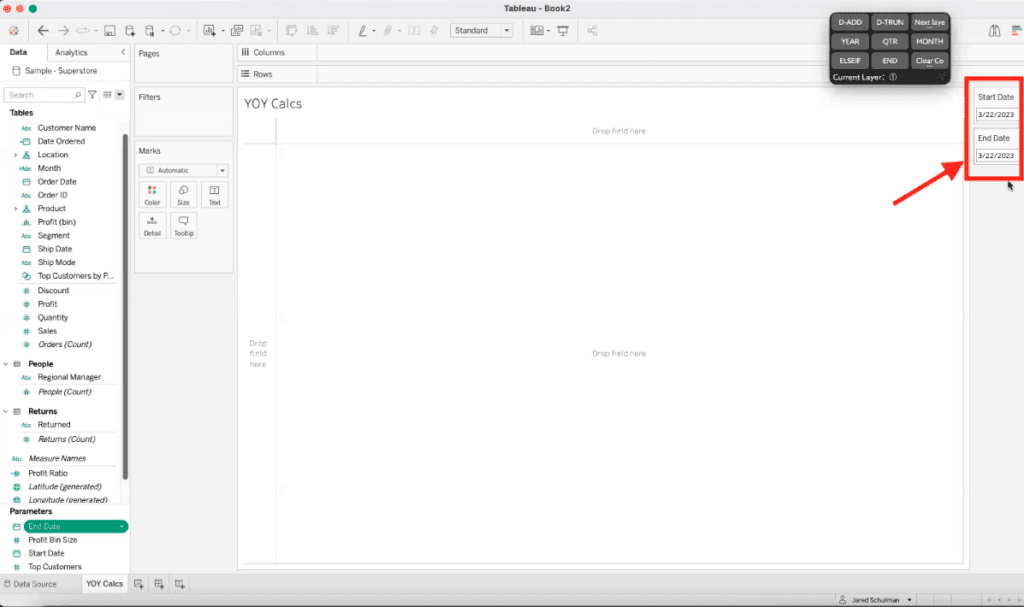
Both the Start Date and the End Date will default to today’s date. So let’s edit the dates to the desired dates. We can update the dates by clicking on it, and a calendar will pop out. We’ll use 1/1/2023 – 3/22/2023 for this example.
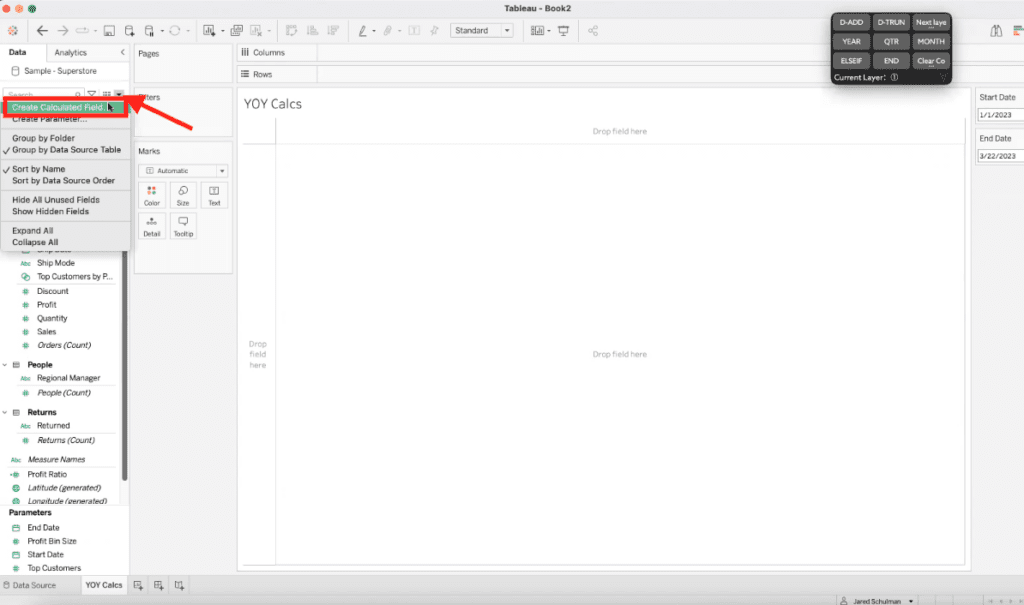
2. Define the Measurements
Click on the dropdown menu under the Data column and select “Create Calculated Field…”
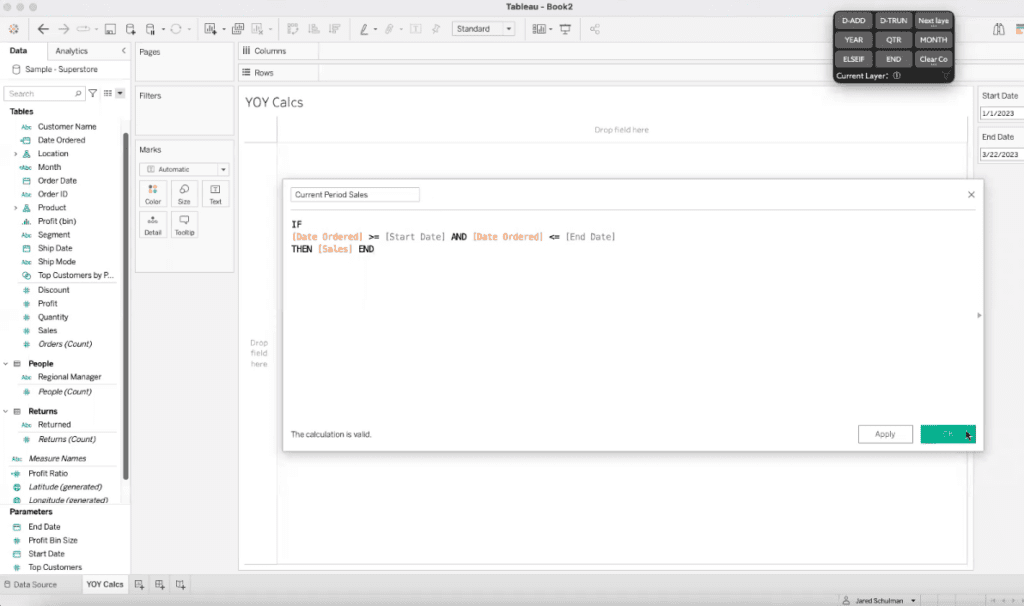
We are going to create a calculated field for Current Period Sales. To perform the calculation, we’ll create the following:
IF[Date Ordered] >= [Start Date] AND [Date Ordered] <= [End Date]THEN [Sales] END
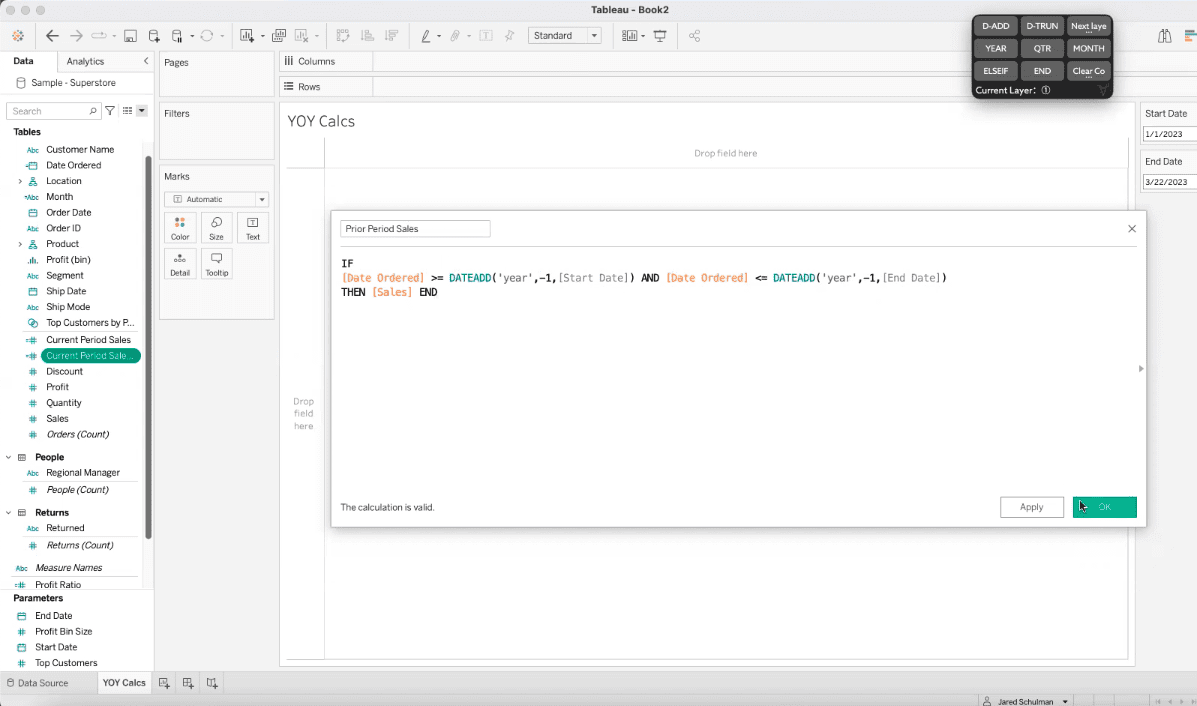
Now, we are going to create the previous period of sales for last year. We are going to duplicate that calculation by going to the left-hand side column and right-clicking the calculation we just created called “Current Period of Sales” and selecting “Duplicate.”
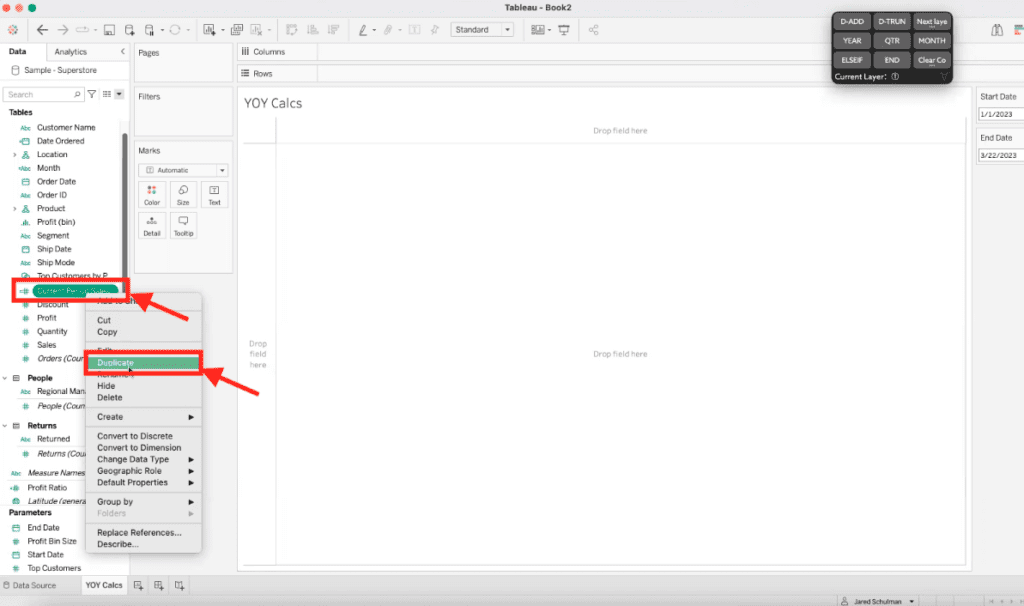
We are going to rename the field to Prior Period Sales. And we’ll edit the calculation:
IF[Date Ordered] >= DATEADD('year',-1[Start Date]) AND [Date Ordered] <= DATEADD('year',-1) [End Date]THEN [Sales] END
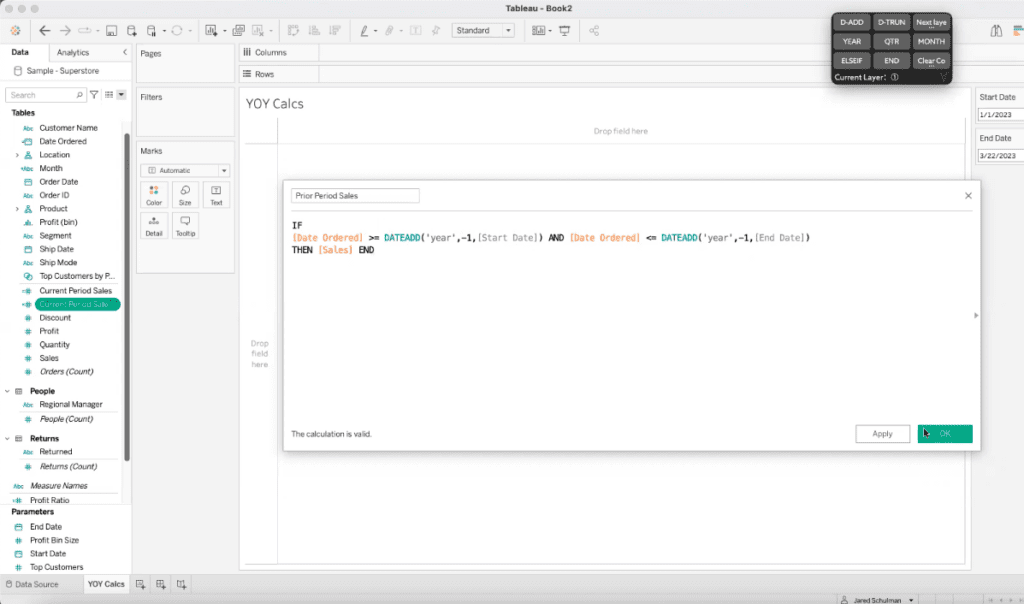
The date add function works by subtracting one from the year of either the start date or end date. This is done by using commas to separate the date part, interval, and date that need to be changed. The order of these elements is important and should be maintained as date part, interval, and date.
3. Test Calculations
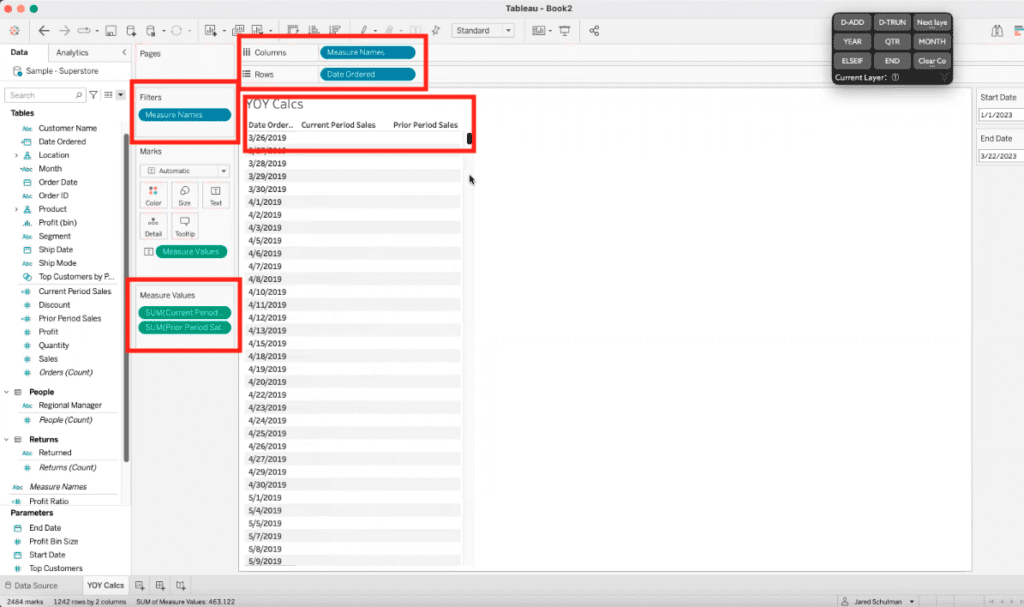
We are going to test this by bringing out our “Date Ordered” onto rows.
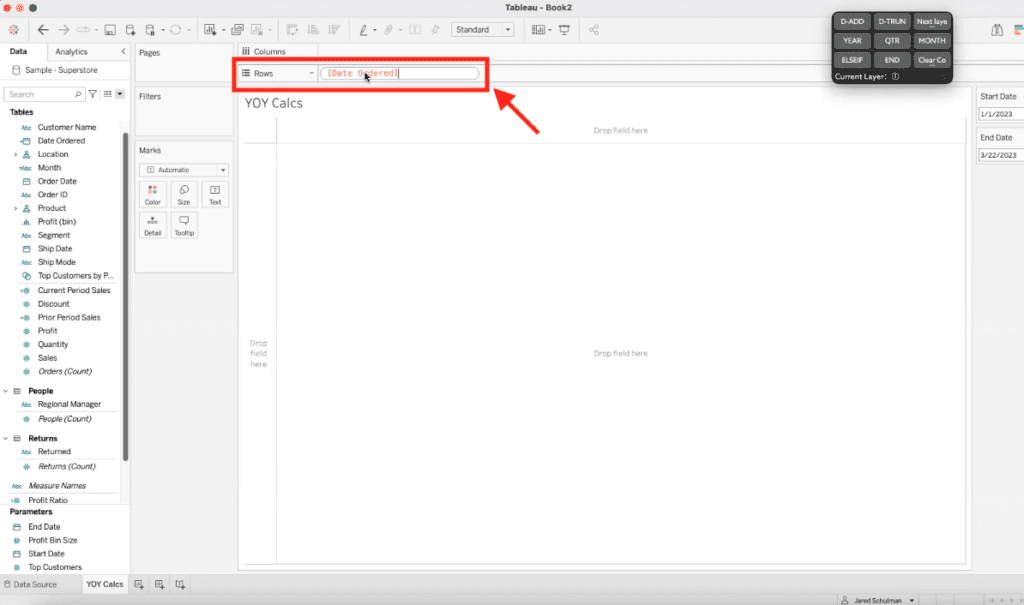
This will bring out all the different dates in our data.
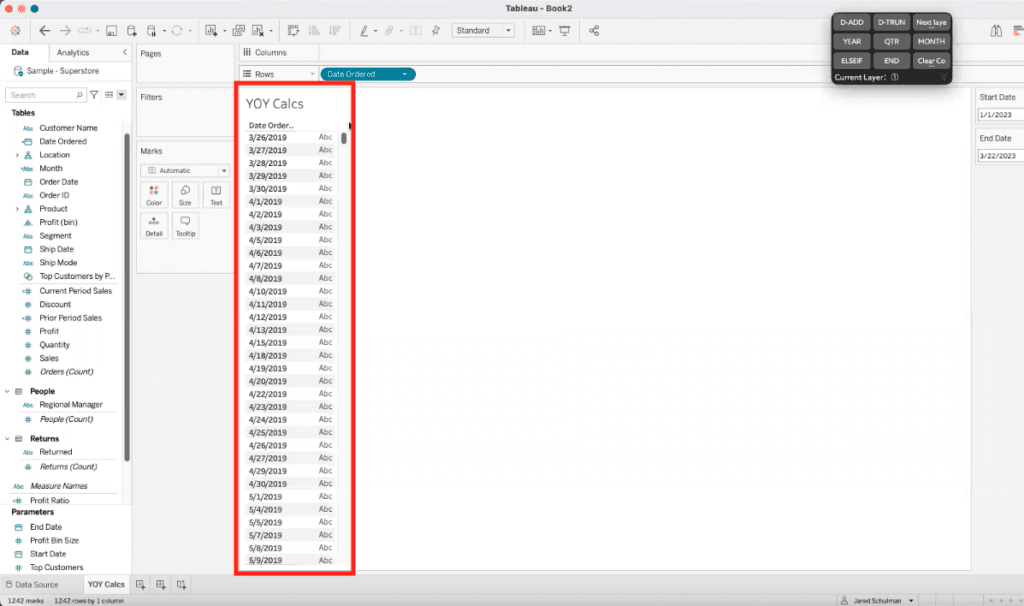
Now, we’ll also bring out “Current Period of Sales” by dragging it next to the “Date Ordered” column.
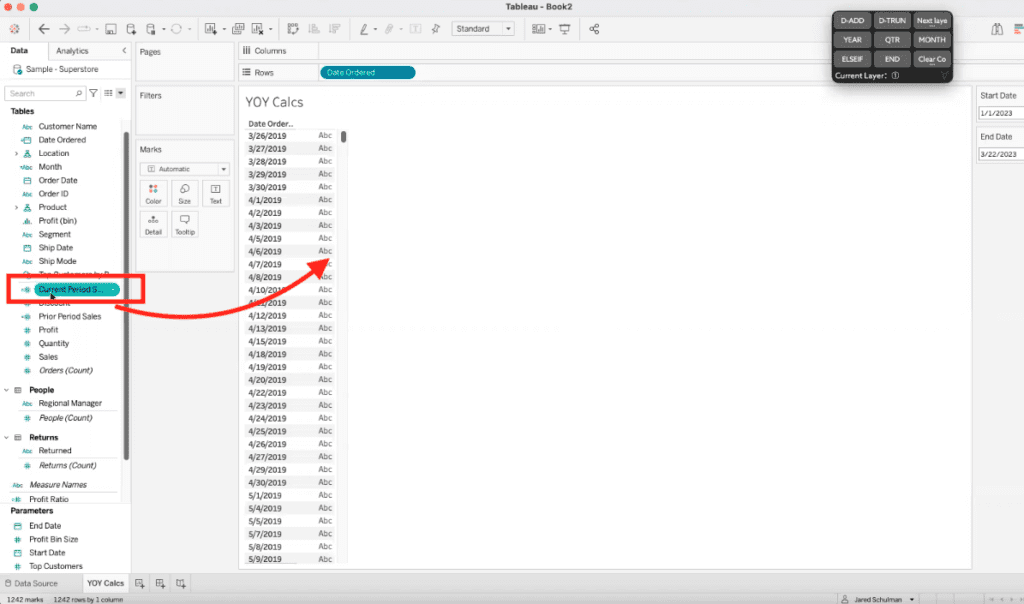
We’ll repeat this step for “Prior Period of Sales,” which should look like this.
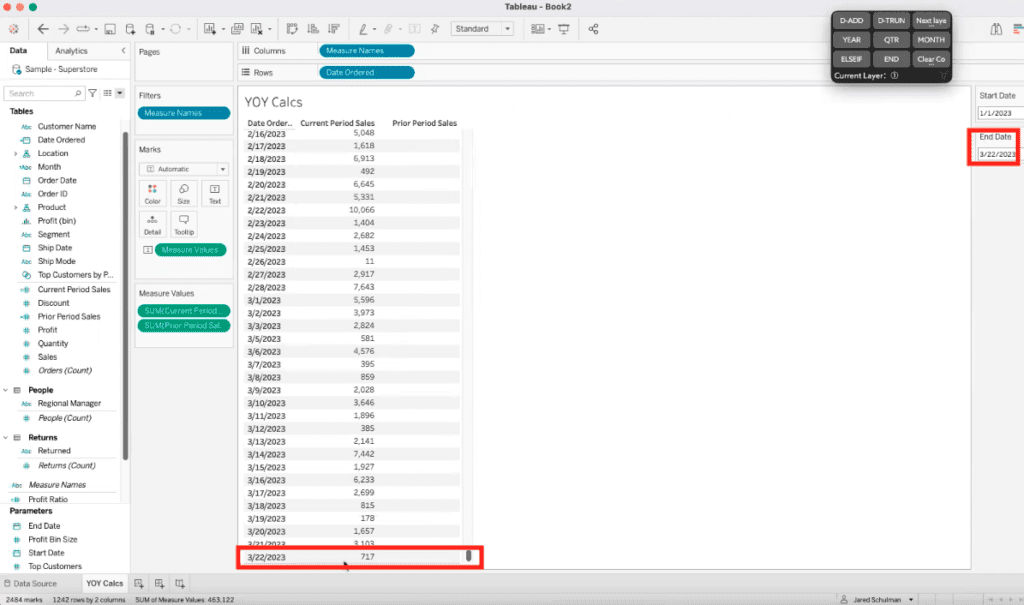
Then, we’ll scroll down to a year before the date we selected as “Start Date” and see how the “Prior Period of Sales” column starts to populate.
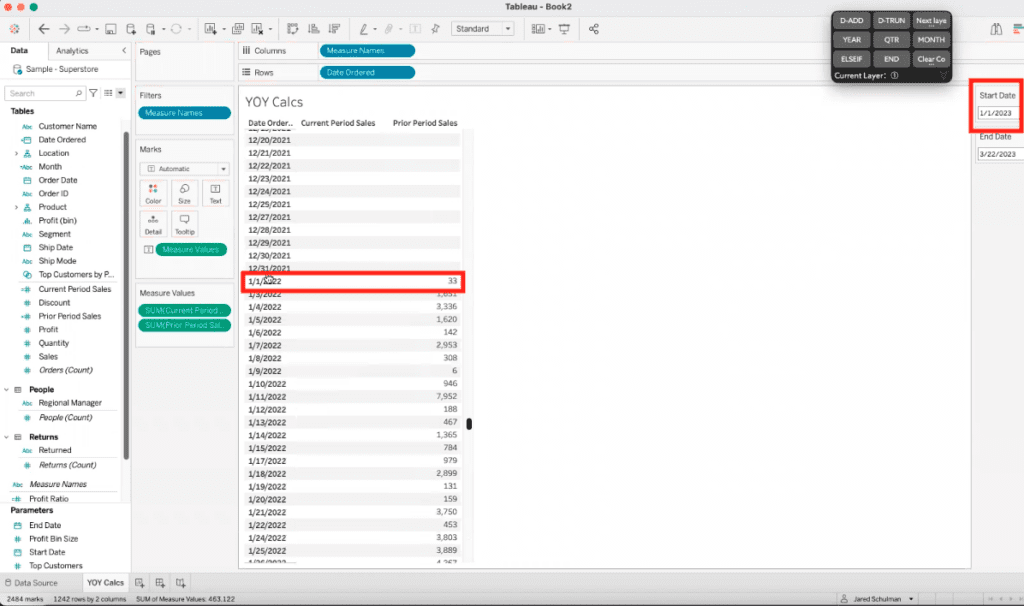
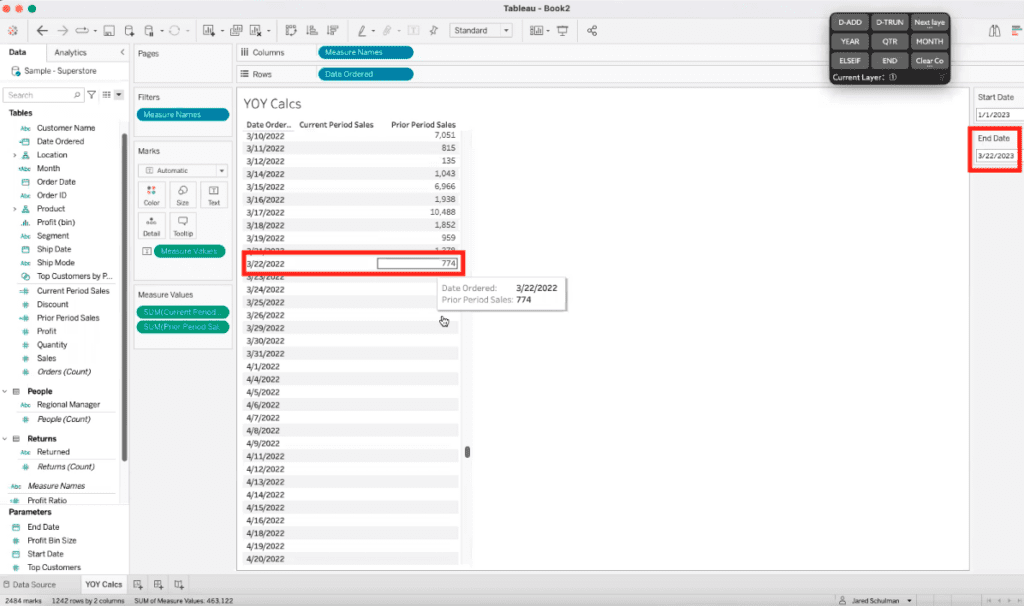
We’ll do the same and scroll down to a year before the date we selected as “End Date” and see how the “Prior Period of Sales” column stops populating.
Now, we’ll scroll down to the date we selected as “Start Date” and see how the “Current Period of Sales” column starts to populate.
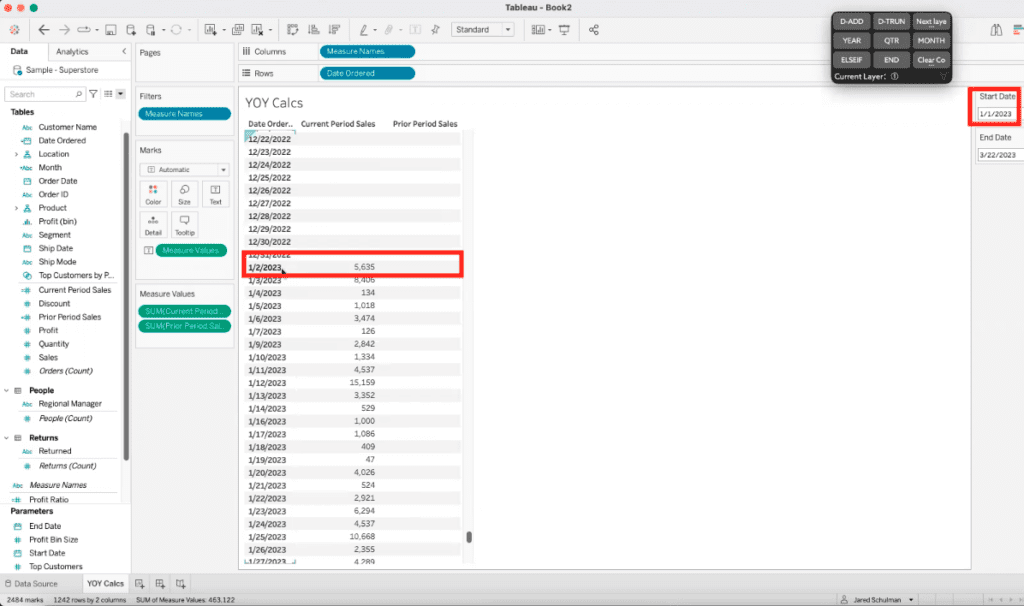
We’ll do the same and scroll down to the date we selected as “End Date” and see how the “Current Period of Sales” column stops populating.
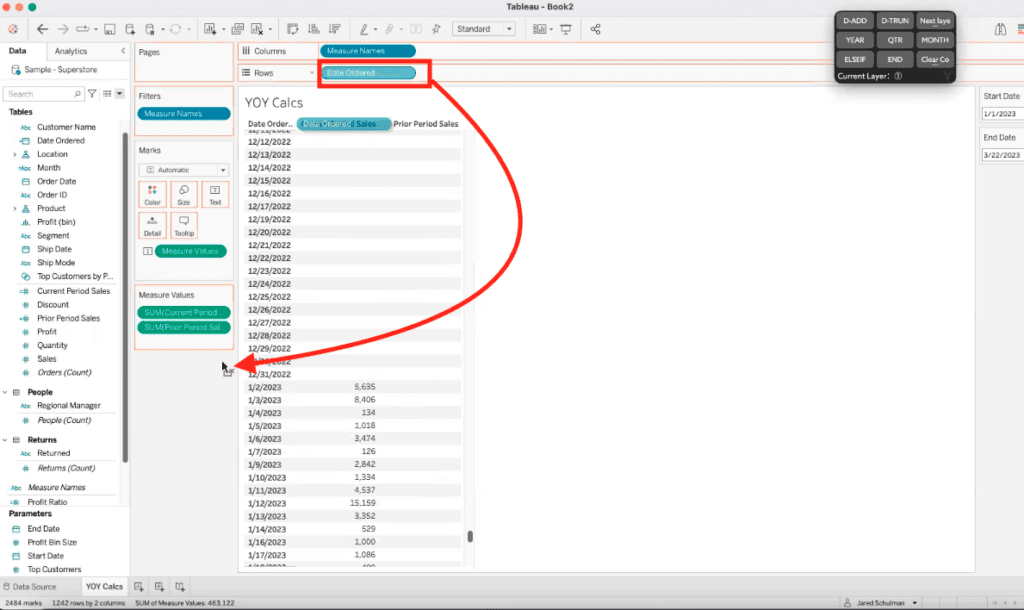
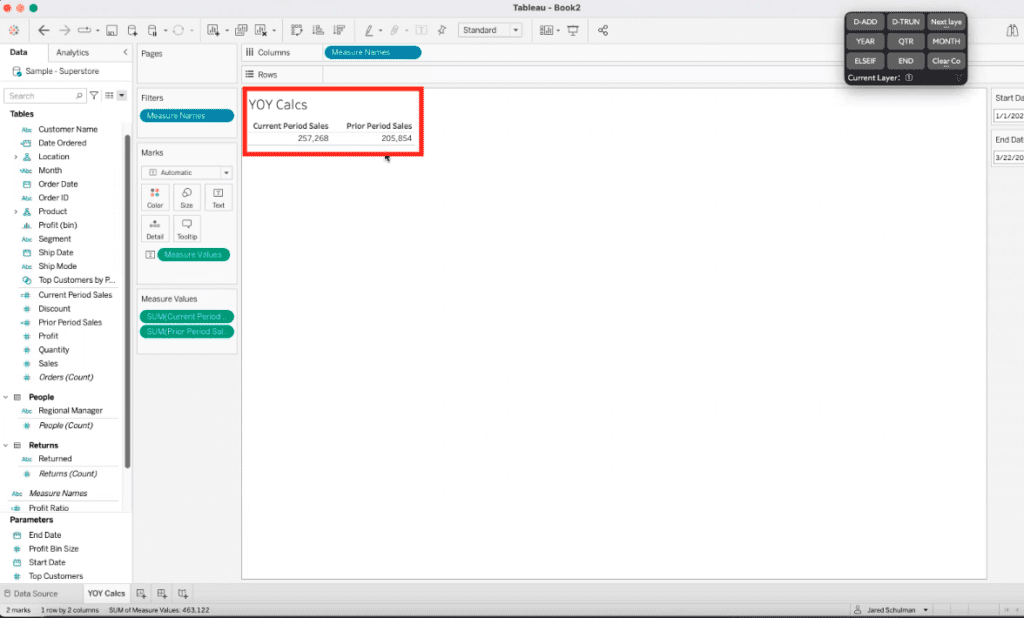
After verifying that the correct dates were obtained for the two different calculations, we can remove “date ordered” from the rows. We do this by dragging “Date Ordered” from Rows to anywhere below Measure Values.
By doing this, we can see that the current period sales amount to just over 250,000 while the prior period sales were just over 200,000.
XeoMatrix Can Help
If you’re not sure how to build year-over-year calculations in Tableau or whether they’re the right choice for visualizing your data, XeoMatrix can assist you.
Whether you need personalized Tableau training to create your own dashboards and insightful data visualizations, or if you’d like us to design a custom dashboard or embedded analytics solution for you, our Tableau service offerings will get you started on the right path.
About XeoMatrix
XeoMatrix offers data and analytics consulting services to help companies understand their data so they can make better business decisions. Our proven approach simplifies the development process so our clients can focus on analyzing their business, streamline data visualization, and ultimately improve ROI. Contact us today to learn more about our business intelligence and data warehousing solutions.