Tableau provides powerful tools for visualizing geographic data, but sometimes you need to define your own custom geographic regions that aren’t available by default. For example, you can map Designated Market Areas (DMAs), sales territories, or other custom boundaries. In this tutorial, we’ll show you how to create a custom geographic region field in Tableau using zip codes.
Tutorial Video
Understanding Custom Geographic Field in Tableau
By default, Tableau recognizes standard geographic roles such as country, state, county, and zip code. However, if you need to work with a non-standard region—like DMAs—you can create a custom geographic field by associating it with a recognized location type.
For this example, we will:
- Use a dataset that contains a list of DMAs and their corresponding zip codes.
- Assign the DMA field as a custom geographic role based on zip codes.
- Visualize the custom regions on a map.
Step-by-Step Guide
Step 1: Load Your Data
Ensure that your dataset contains a column for the custom region name (e.g., DMA Name) and a column with a geographic identifier that Tableau recognizes (e.g., zip code). Once your data is loaded into Tableau, navigate to the Data Source tab to confirm the structure.
Step 2: Assign a Geographic Role
Since DMAs are not a default geographic role in Tableau, we need to define them using an existing geographic field. In this case, we’ll use zip codes to create the custom geographic role.
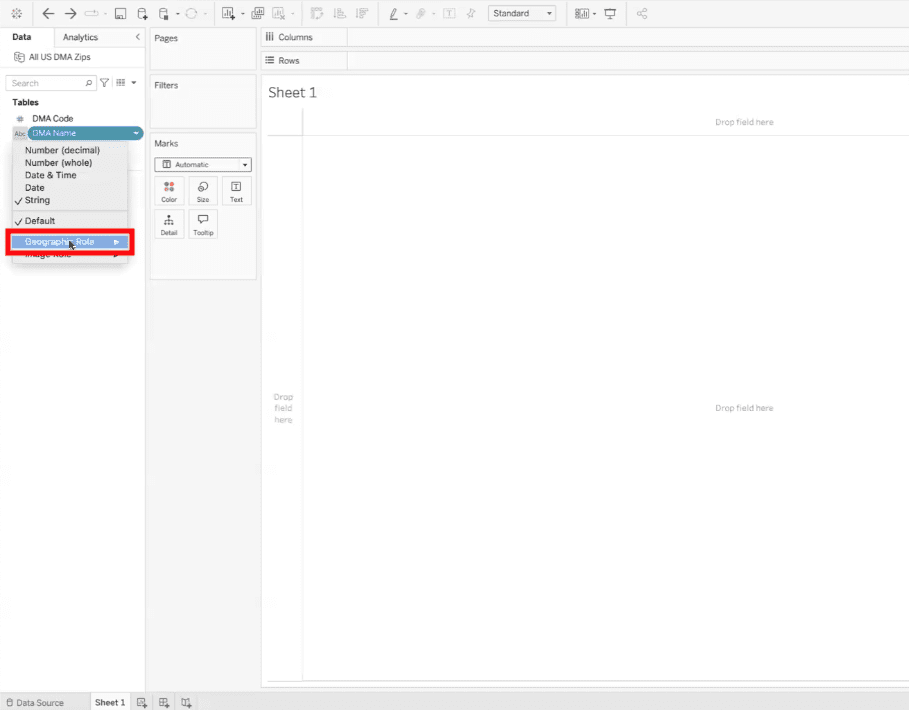
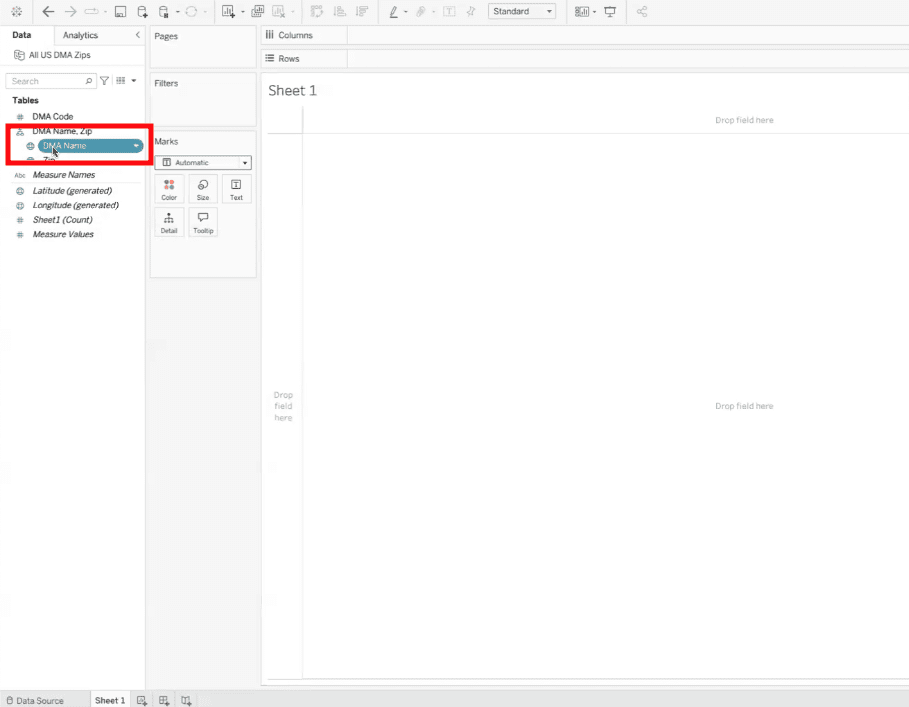
1. In your Data Pane, locate the column that contains the custom region names (e.g., DMA Name).
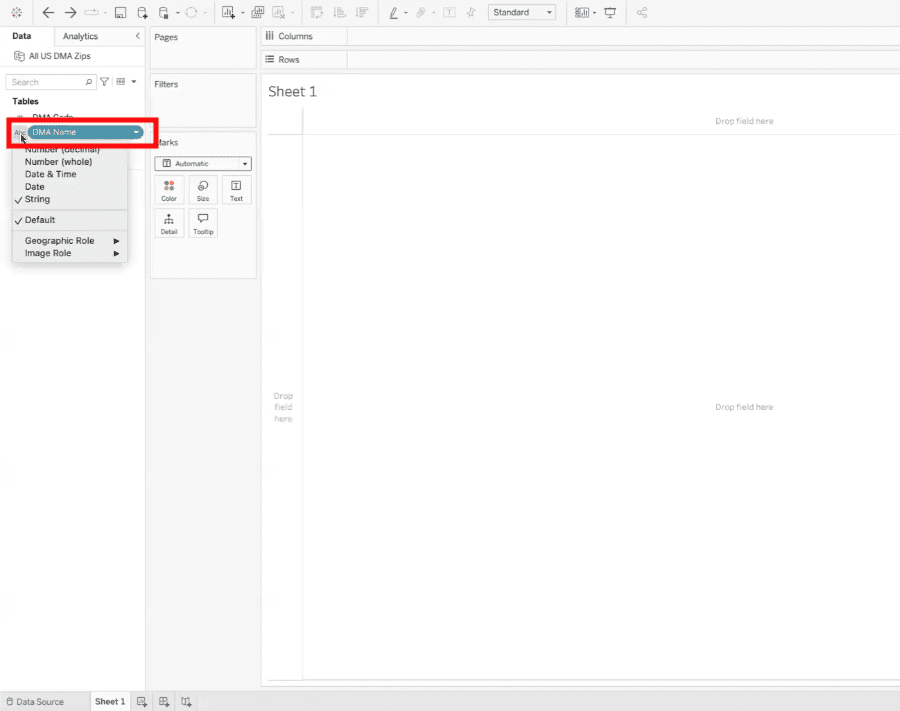
2. Click on the field and select Geographic Role > Create From.
3. In the dropdown menu, select Zip Code as the base geographic field.
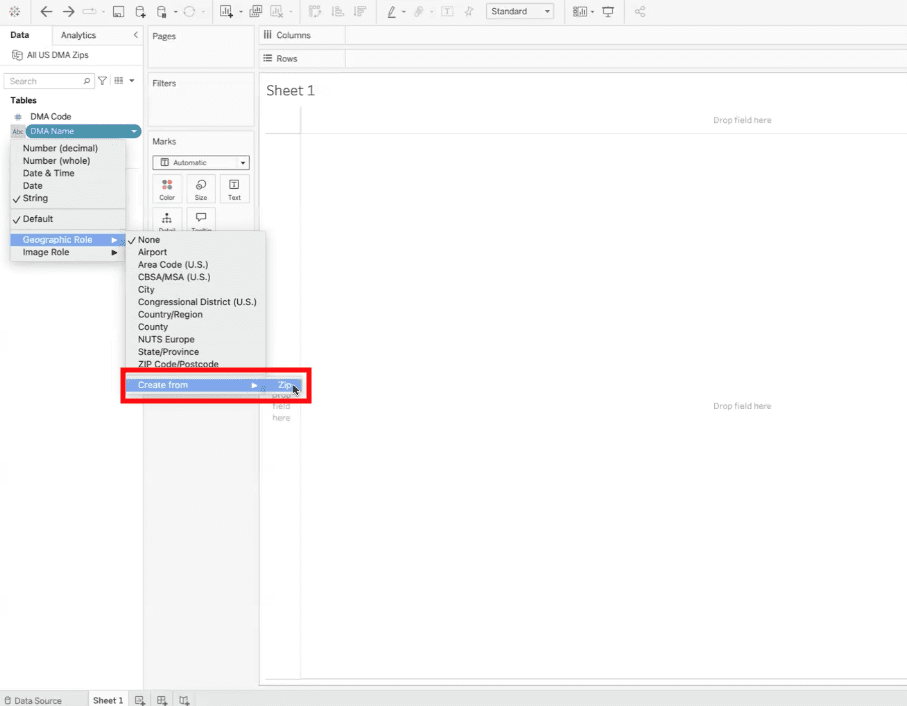
Now, Tableau will treat the DMA Name field as a geographic region, using zip codes to determine locations.
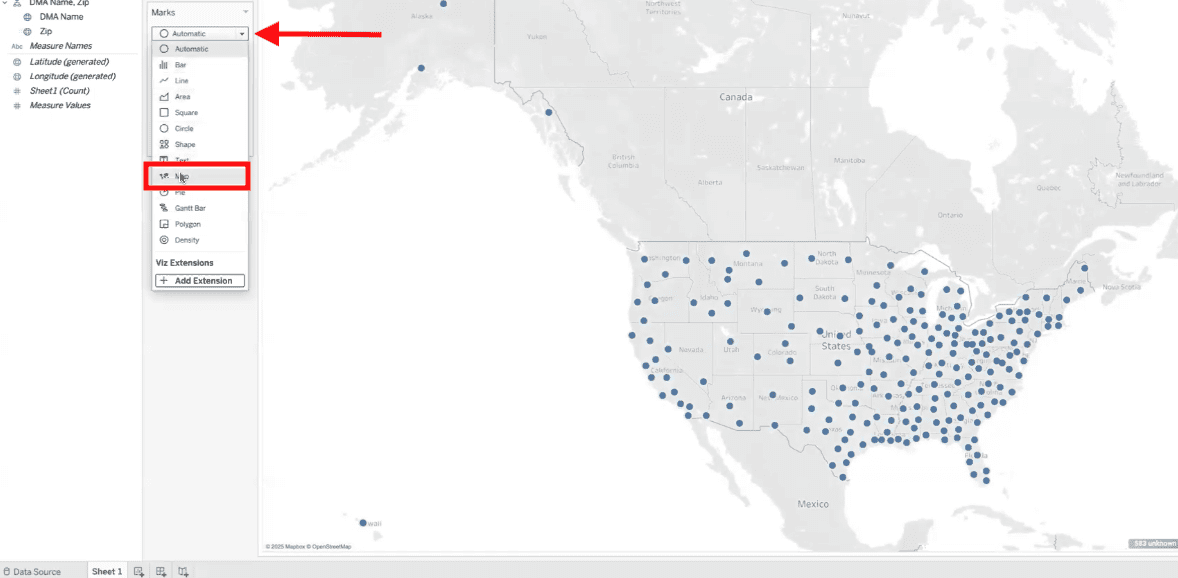
Step 3: Create a Map Visualization
Once the DMA field is assigned a geographic role, we can visualize it on a map.
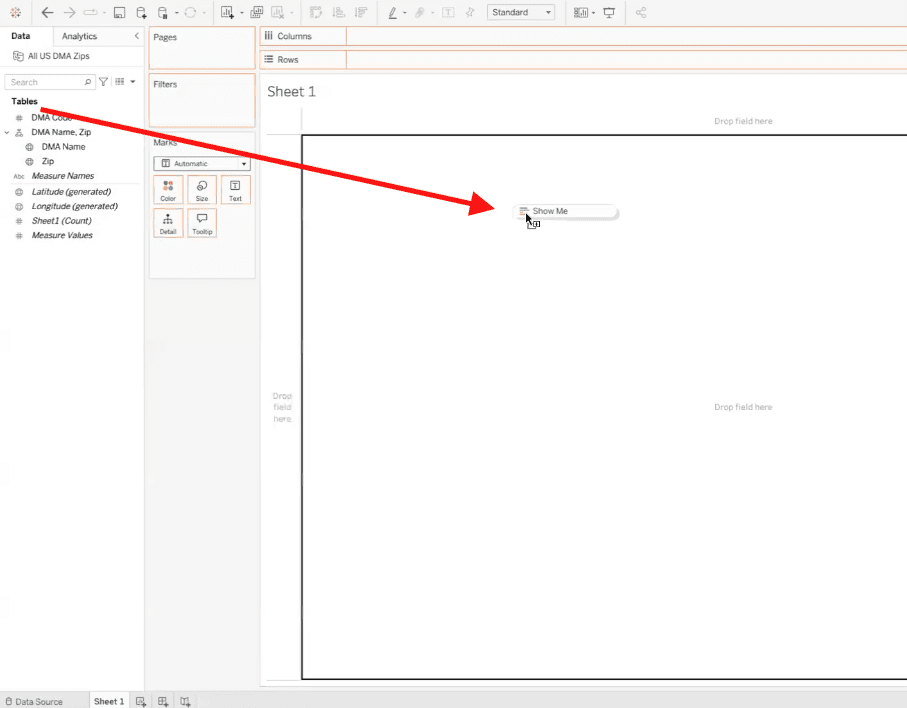
1. Drag the DMA Name field onto the Rows shelf.
2. Change the Marks type from “Automatic” to Map.
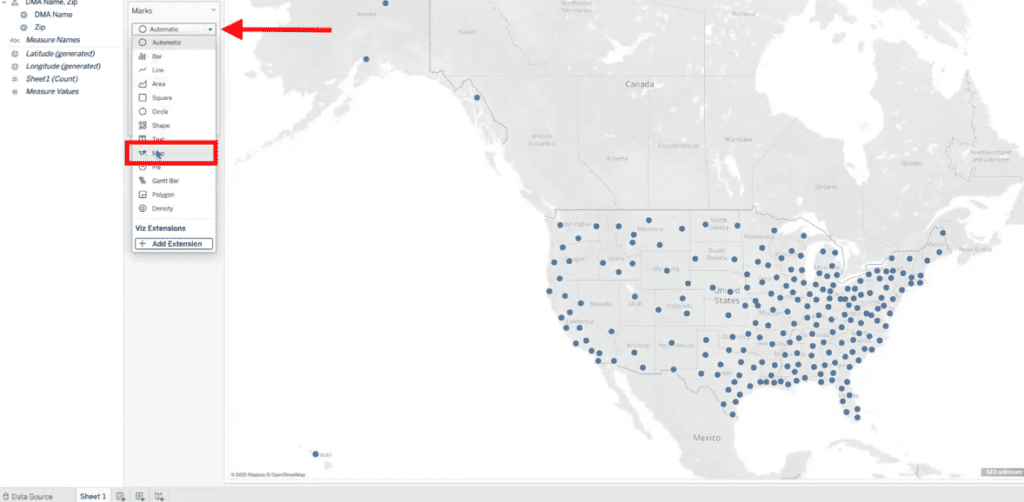
3. Tableau will now generate a map with the custom DMA regions highlighted.
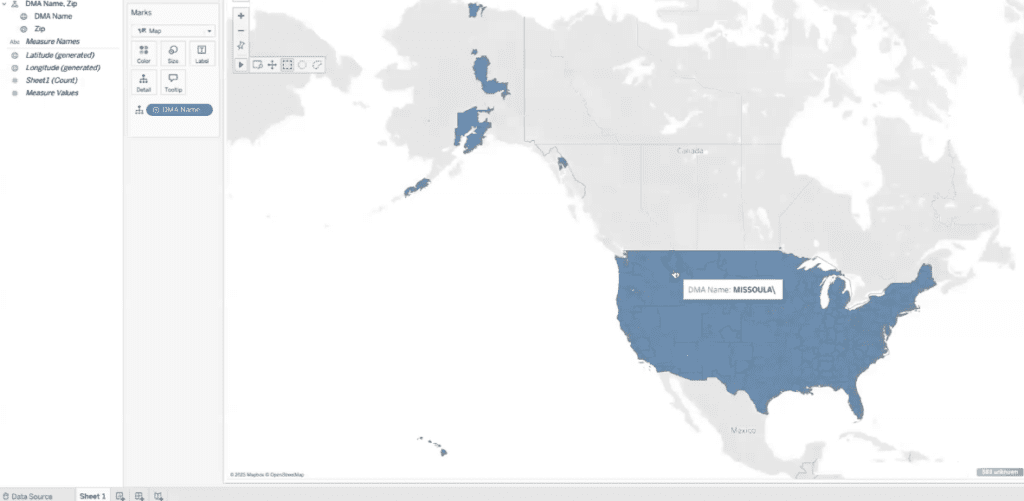
If Tableau doesn’t recognize some locations, ensure your zip code data is complete and formatted correctly.
Step 4: Save and Share
Once you’re satisfied with your custom geographic visualization, you can:
- Publish to Tableau Server or Tableau Public for sharing.
- Export as an image or PDF for reports and presentations.
- Use filters and interactivity to allow users to explore different data points within the custom regions.
Need More Help with Geographic Data in Tableau?
Creating a custom geographic region field in Tableau is a simple yet powerful way to enhance location-based analysis. By associating a custom region name with a recognized geographic field, you can unlock new insights and visualize data in ways standard geographic roles don’t allow.
With XeoMatrix, you’ll receive personalized guidance to maximize the utility of Tableau, transforming your data into actionable insights with ease.
About XeoMatrix
At XeoMatrix, we specialize in providing comprehensive data and analytics consulting services to empower businesses to gain deeper insights from their data.
Need help optimizing your Tableau visualizations? Our team at XeoMatrix specializes in Tableau consulting, helping businesses maximize their data insights with customized dashboards and mapping solutions.
Our proven methodology simplifies the development process, allowing our clients to concentrate on analyzing their business trends effectively. By streamlining data visualization, we pave the way for enhanced decision-making and improved ROI.
Contact us today to discover how our tailored business intelligence and data warehousing solutions can drive your business forward.