Many early adopters of data and analytics solutions chose a solution that at the time might have been best in class as their solution of choice. Back then, it was the right solution for their business, but let’s be honest, that legacy solution is no longer the best in class or a modern analytics solution and has probably not kept up with the analytics needs of your organization.
Businesses have changed a lot in the last 5-10 years. They need a modern data and analytics solution that can help plot your future, not keep them grounded in the past, and deliver greater insights, enabling their teams to do more with their data.
The presenters shared their perspectives on the challenges organizations face when they have outdated legacy data & analytics solutions and how moving to a modern BI platform can take your business to the next level. PF Chang’s shared how they made the decision to move to a modern BI platform and the steps they took to ensure their migration was successful.
Here is what you will learn:
- Pain points and challenges of outdated legacy platforms.
- How a modern analytics solution specifically solves these pain points.
- How to effortlessly migrate from your legacy platform to Tableau.
- The ROI generated by organizations similar to yours.
This article includes a recording, transcript, and written overview of the Modernize your Legacy BI for Retail Consumer Goods with Tableau and XeoMatrix presentation.
Presentation Video
Summarized Presentation
The event focused on providing attendees with the challenges organizations face when they have outdated legacy data & analytics solutions and how moving to a modern BI platform can take your business to the next level. PF Chang’s shared how they made the decision to move to a modern BI platform and the steps they took to ensure their migration was successful.
Presentation Outline
The three-part session follows this outline.
Revolutionizing Retail Analytics with Tableau
- Evolving Data Strategy in Retail
- Historial Perspective on Analytics
- Data Explosion and Transformation
- Legacy BI Challenges and the Tableau Approach
Modernize Your Analytics: Migrate Legacy Platforms to Tableau
- What is BI Modernization?
- Legacy BI vs. Tableau
- Choosing the Right Strategy
- The Migration Process
- Best Practices and Recommendations
P.F. Chang’s Tableau Migration
- Where we Were? Life Before Tableau
- The Migration to Tableau
- Where we Are with Tableau
Transcript
>> COURTNEY: OK. Hello, everyone, and welcome to today’s webinar. Is your data and analytics solution feeling a little dated? Today, we’ll explore the challenges posed by outdated legacy, data and analytics solutions, and how moving to a modern, business intelligent platform can propel your business into a prosperous future. Listen in as we have P.F. Chang’s, XeoMatrix, and Tableau here to share insights on these pain points, migration strategies, and the ROI achieved by organizations just like yours.
As always, feel free to add any questions or comments into the chat at any time throughout this presentation, and with that, Ian, I’ll pass the mic over to you and the floor is yours.
>> IAN REED: Hey, thank you, so step one here, let me go ahead and share my screen, make sure everything looks good. Awesome.
So welcome. Thank you, guys. My name is Ian Reed. I lead our retail and consumer goods solutions engineering team here at Tableau. That is a mouthful. Been here for going on three years now, and prior to joining Tableau, i actually came from the customer side.
So I was at Signet Jewelers, most notably known for the parent company of brands like Kay, Jared, Sales, Piercing, Pagoda, and the list goes on and on, and much like you guys, I was in the trenches. I dealt with all the struggles that you guys have with data, the demands, a lot of times, the Legacy BI. You name a BI solution, we probably had it. We had the Excels, the MicroStrategy, the business objects, and everything in between, and I had the great luxury of introducing them to a new way of thinking, that being Tableau, and it revolutionized the way we thought about data, the way that we interact with data, and I’m excited to share that story with you guys today.
So my goal is, as much as I love to be on camera, not to be the star of the show, but actually set the stage for my peers, so we have an amazing lineup presenters that are going to kind of walk you through why we’re seeing so many customers strategically change the way they’re interacting with data to a more dynamic self-service focused data strategy, and, of course, highlight that with some amazing customer success stories, but before I do, I want to take a step back and walk you guys through a trip down memory lane.
So what is the history of analytics? What is the history of BI? And kind of why we’re at a pivotal point in the industry in how we interact with data, so I cannot believe I’m saying this, but we’re actually coming up on the 30-year anniversary with Microsoft Excel. MicroStrategy, business Objects, obviously not too far behind, and as you can imagine, as revolutionary as the technology was back then, we’ve come a long ways in 30 years, not just in technology, but also in the demands that we’re making of our data.
Although these companies try their best to keep up with the ever-changing environment that we’re in, but just like the foundation of a house, the technology that those products were built on makes it difficult for them to adapt, so absent of starting all over, you have to build around that original foundation, that original code script, which presents a unique set of challenges.
To put that into context, this is what was considered in 1985 to be cutting-edge technology, so this is disk storage for 1GB of data. Back then, that went for anywhere from $80 to $90,000 in 1985. Translate that to today when we’re not working with Gigabytes, but actually working with Terabytes, that equates to $91 million, or $213 million, adjusted for 2023 dollars.
Now, as of yesterday, again, we’re working in Terabytes, not Gigabytes… On Amazon, you can get 1TB storage in a tiny little disk for as little as $96.31, so at its core, this technology was never designed for large volumes of data, much less these quickly dynamic changing environments that need to adapt to the business needs.
Now, according to the World Economic Forum, we’re collecting 500 exabytes of data every single day. Cannot even begin to wrap my head around that much data. That’s the equivalent of 500 million terabytes or 500 million of those little disks that I showed in the previous screen, and there’s no end in sight, which is the struggle that retailers are faced with today. We’re collecting so much information, and we’re collecting it all over the place, but to what end? If we’re not acting on that data, then what’s the point of collecting it to begin with?
Now, I probably sound like a broken record, but, again, Legacy BI tools were never designed for this big data, for these complex data environments. They were built to sit on top of proprietary data warehouses, and then they would limit the analysis to a small aggregated slice of data. Each of these pieces of information needed to be cleansed, needed to be modeled, and they needed to be prepared for analysis.
What this turned into is almost report factories for these organizations, which led to large backlogs of requests from the business, some of those pain points that those business users felt, it’s time. Took too long to answer very simple business questions, especially when that question required new data or new business logic.
Number two, skill shortages, because it required a very technical resource, there was a rising cost of hiring these users, that unique skill set, and a skyrocketing consulting fees. It’s not something that an everyday user could do, and then finally, what that led to is, oftentimes the business users, they just gave up. They couldn’t afford to wait for this report factory cycle to run its course, and often, the window in which they could act on that data came and went.
In my experience, what often tends to happen is that these organizations start to use these Legacy BI solutions almost as a query engine. They would take the data from these solutions and pipe them directly into Excel.
Myself, much like many users, have your Monday morning reports. I grab my data from five different sources. I do my VLOOKUPs, I do my pivots, I reshape. I reformat my data, I color it, ultimately to send that exact same report out each and every day to my end users.
The problem with that, aside from being an unfulfilling job, is we lose that business logic, so indefinitely, what would happen is, I would leave the organization, super cliché, I win the lottery or get hit by a bus. More than likely, I just move around somewhere, but the logic to build that report doesn’t sit memorialized anywhere. Instead, it sits up here.
Number two, user error. I do that same report each and every day, and indefinitely, my keyboard is shifted a half inch to the right. I have my keystrokes memorized. I fat finger the wrong number, and now the report is gone. The report is incorrect, and as I start to share that out, what that leads to is data duplication, so that report is sitting all over the organization, and what happens is, somebody uses my report to build their report, and now you have data sprawl, so now none of those reports start to line up, and we spend more time validating whose number is right than actually answering questions or changing the way that we interact with data.
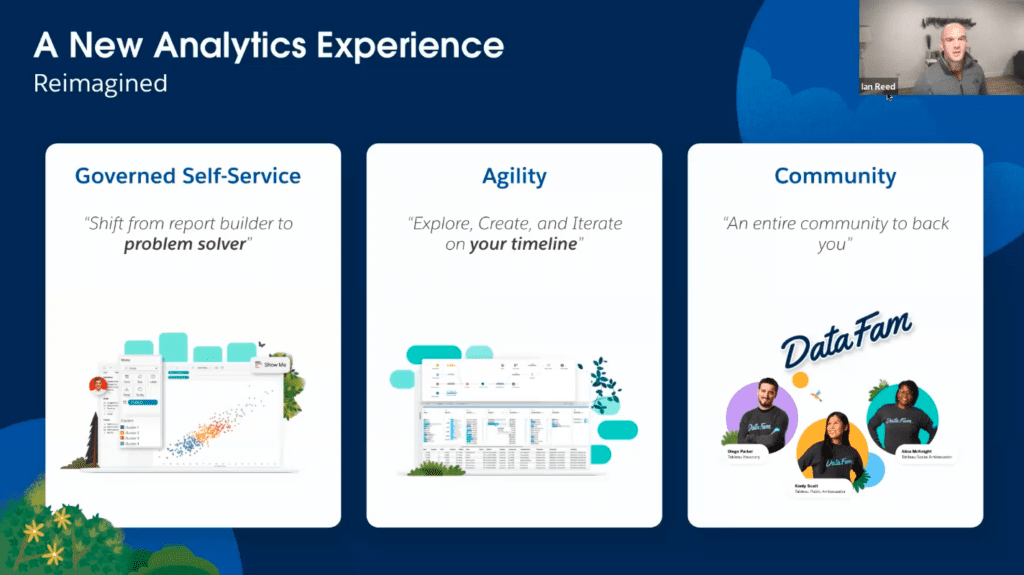
So what we’re going to be sharing with today is a new way of thinking about data, a new way of thinking about analytics, and it’s reimagining it. If all you’re doing is simply taking your report in Legacy BI solutions, like a MicroStrategy, like in Business Objects, and mirroring them in Tableau, I would argue you’re doing it wrong. The idea here is to think about data in a new lens. What that could look like is govern self-service, so we need to shift that mindset from our end users from being report builders and into problem solvers.
In order to do that, we know that the analytics lifecycle is very iterative. As I find one insight leads to another question, which leads to another insight, which leads to another question, so the idea is we need a solution that lets us explore, create, and iterate on my timeline so we don’t miss that window of opportunity.
Finally, we do that with the community. This is the part of Tableau that is so near and dear to my heart, and part of the reason that I went from the business to over here, because I love helping other users, and that’s, suffice to say, we have an entire community to back you, so whether that’s your DataFarm at your organization or your DataFarm across the Tableau ecosystem, some of the longest lasting, most impactful relationships I’ve built in my career come from that Tableau network.
So with that, I am going to turn it over to Chris, and dive into it in more detail.
>> CHRIS MONAHON: All right, well, thank you, Ian. I’ll go ahead and share my screen. All right, well, thank you, Ian, for sharing your perspective and your experience using Legacy BI platforms. I think you really painted a picture of some of the pain points that a lot of end users have.
Today, what I want to do is talk a little bit about how you can modernize your analytics, especially moving from a Legacy platform over to Tableau, what BI modernization is, and what the steps of that migration process look like.
So quick introductions. My name is Chris Monahon, president of XeoMatrix. We’re a Tableau Gold Partner based here out of Austin, Texas, and we help organizations with their deployment, training, and adoption of Tableau. I have over 20 years of data analytics experience, and prior to XeoMatrix, I worked at MicroStrategy, so I got a lot of experience with Legacy BI platforms, and our team specializes in a lot of these Legacy BI migrations over to Tableau.
So we got a lot we’re going to cover today in the agenda. First, I’m going to cover, what BI Modernization is. Then we’ll touch on how you go about choosing the right strategy for your migration, what that migration process is, and then we’ll end with some best practices and recommendations.
So first of all, what is BI modernization? It’s how Ian painted the picture of a Legacy BI Platform. You’re trying to move to a more modern application, more modern platform, a better way to do your analytics, so that’s moving from the Legacy BI applications that Ian outlined over to a more modern platform like Tableau, some of those Legacy BI Platforms that come to mind, it’s Cognos, Business Objects, MicroStrategy. A lot of them are there. Our old friend Excel is still there as well. These are some of the ones that we see a lot, and that a lot of people are considering moving off of.
What are the challenges with these platforms today? Well, there’s definitely a higher total cost of ownership, right? A lot of times the licensing is expensive. There’s definitely longer development times because usually the software is clunkier to use. It’s not as modern so there’s not better, quicker, more efficient ways of producing the reports and analytics that you need. There’s no product innovation.
So these are more frozen in time, and they’re not really innovating on their product, and, of course, a lot of times these also need more IT resources. Back in the day, that’s what and how things were done. You would have a whole team that supported the business, and a lot of times there were those report factories where you would have teams just generating reports on behalf of users, so there’s more administration and a lot more training that’s required with Legacy BI, so those are some of the challenges.
When we talk about BI Modernization, it’s more than just moving from grids to dashboards. It’s more than just better visualizations. You’re getting a lot more business out of it.
You’re getting more self-service analytics. It’s more visual, allows and empowers the end users to make their own decisions and to build their own reports and ask their own questions. You’re going to get that quicker time to insight that Ian outlined. It doesn’t take days to produce a report. You can get it in minutes.
Really, at the end of the day, you’re trying to promote a data-driven culture across your organization, and that’s what a BI Modernization can do, especially with Tableau.
So here’s some of the key benefits of BI Modernization and why you might want to do it. First of all, I always tell everyone happy users, higher adoption. That is by far the most immediate thing we see. We see a huge uptick after all of our migrations, where you’re going to get that higher adoption, sometimes as high as 50% rate over like six months, we’ve seen, so it’s great from that standpoint.
You’re also, of course, enabling your organization for self-service reporting, and, again, promoting that data-driven culture. You’re going to get access to new technologies and capabilities. These there’s a bunch of new capabilities that are coming out, especially around AI and NLP that you can leverage there, and, again, it’s going to be easier for your IT teams to support too.
One thing we do note is that with BI Modernization, a lot of times, this is just a natural progression or evolution for your organization, because it aligns with your current IT strategy of either moving to the cloud, or maybe you have a data warehouse that is in the cloud that you’re moving to. You’re going to have to remap this stuff anyway, so aligning a BI modernization initiative along with some of your other IT projects can really get that cost savings, so that’s something to consider as well.
So BI modernization, especially with Tableau, you’re going to get all that self-service analytics. You’re going to get that shorter development times and quicker insights, which will have a big impact on improving your business, and at the end of the day, that’s what you’re looking for and you’re trying to promote that data-driven culture, so again, it’s more than just visual dashboards, of course you get advanced analytics and great-looking dashboards with Tableau.
Here’s one example of some retail analytics dashboard that we did, and you’re going to get that insight into your sales, your customers, your inventory. You can do supply chain as well, but now by modernizing and moving to the cloud, such as Tableau Cloud, you can start getting even more advanced capabilities and features. Tableau is constantly innovating.
If you caught Tableau Conference, you might have saw a sneak peek of something that’s coming out called Tableau Pulse. It’s using Tableau GPT behind the scenes, so AI and some natural language processing. They go ahead and produce powerful analytics just through natural language commands, so this is not only going to change the way that your end users are going to do analytics, how they create content, but it’s also going to change the way they consume content, so this is the future, this is the way things are going, and that’s why you want to modernize your platform.
One example we have, a case study here that we did, was we helped one organization, in this case, specialized in technology solutions for Medicare or Medicaid, but they were moving from MicroStrategy over to Tableau, and they had six years of Legacy MicroStrategy development, so there’s a lot of that Legacy debt. There wasn’t a lot of user adoption, and they definitely had those report factories where it was taking a long time to create these reports and get the analytics they need.
So we helped them develop a migration strategy and a plan to move off of MicroStrategy, and helped to reimagine all those reports in Tableau, and right out the gate, they recognized a 15% increase in user adoption in the first month, and what was even more amazing was they saw an immediate ROI by identifying $2 million of revenue in unmarked claims, so that is immediate revenue recognition that they found.
The irony of that is this report already existed in MicroStrategy. It’s just that no one was using the system or exploring the data, but with Tableau, the users felt empowered, and they found this savings, so that just shows you the power of Tableau.
Let’s talk about how you go about choosing the right migration strategy when you’re looking to modernize. There’s three types of migration approaches.
The first one is your total duration, which is really ideal for maybe smaller to medium footprints. That’s where you want to migrate your whole Legacy platform onto Tableau. It is also a good fit for larger organizations, if you’re looking to do maybe a phased approach.
Then there’s a partial migration. This is where you’re looking to just replace a Legacy application at a department level, so this is also good too. If you are going with a migration and a phased approach at a large organization, you can go ahead and tackle it by doing partial migrations.
Lastly, the other type of migration that we see is a new implementation, so if you’re looking to Modernize, but maybe not ready to make that plunge yet, you can start with a new implementation of Tableau, and really get your users accustomed and using Tableau, and then you can start seeing the adoption and then start that process of replacing the Legacy platform that you currently have.
So there’s three steps when you’re trying to choose a strategy and which one is right for you. Well, you want to first start by performing an assessment. You want to ask yourself what challenges you have today. Is it lack of adoption? Is the system difficult to use? Are you seeing a lot of Shelfware, deprecated reports? And, definitely, are you seeing long development times, or have those report factories going on?
If you see any of these behavior, like bursting reports and things like that, there’s a more modern way to do it and you likely need to make that change and modernize, and consider these pain points when you’re doing your assessment. Then you would start the planning.
So again, identify some of the highest pain points for your organization. Is it cost, usability, adoption? What is the impact on your organization? And how many people does not have a more modern BI Platform affect? Then you want to understand which groups or departments or users are going to be the first to migrate, and those will be your champions and promoters of Tableau, and then identify your timelines.
Lastly , you want to perform what we call an object inventory assessment, and that’s where you are really analyzing how many objects you have in your Legacy platform and how many of those objects need to be moved, and we’ll touch on that in a second as well on what that process is, and once you’ve determined all those from the first two steps, you want to craft your strategy, and then just identify which approach works best for you.
So, again, if you’re doing a total migration, that might be suitable for you if you have poor company-wide adoption and you’re really just looking to reimagine your analytics, then a total migration probably makes sense. Especially if you’re looking to maybe adopt a new BI corporate standard.
If there is a data modernization, a data warehouse modernization, or moving to the cloud, like I mentioned, or especially like a big license renewal that you have, total migration probably makes the most sense.
Partial migrations definitely work a lot better or are more suited for large organizations that are looking to chip away at a large user base. We’re talking about some of those that maybe have 20,000 users. Partial migration makes a lot of sense for them.
Then lastly, that new implementation is going to be, if you have not yet identified the process for your Legacy migration, then just get started with Tableau, with a team that maybe needs analytics, and get them started as well, so that’s a little bit how to go about choosing the process.
One question we get asked a lot is what that migration process actually look like. When we do our migrations, there’s five objectives that we’re trying to accomplish. One is simplifying the migration from your Legacy BI over to Tableau. Secondly, we want to reimagine analytics through Tableau. We don’t want to do a lift and shift, right? If we were going to do that, you could just stay on your current platform. We want to reimagine analytics in Tableau, and then we want to provide end-user training, of course, to your users to enable them, and that way we can get the correct adoption from them as well. Then, of course, we want to make sure that your internal BI team has all the knowledge they have to support and administer Tableau and the platform.
So here’s an example migration strategy that I put together. Typically, we try to shoot for around, depending on the size of the migration, maybe it’s three months, so that’s this example, and what we want to do is, we’re going to break this down into two phases.
At first, we’re going to do an object-inventory assessment, where, again, we identify all the objects that need to be moved from your Legacy BI application, and then we start to work with the business to identify which ones are high priority to the business and which ones are lower priority objects and which ones don’t need to be migrated at all, and then from there we create a project plan or a migration road map, we call it. Phase one is going to be a migration of all those critical and high-priority objects, and then phase two are going to be those lower priority objects that I mentioned as well.
So when we do these migrations, we want to definitely focus heavily on training and enablement. That starts with your development team. A lot of times we do co-development, so we would train the development team up, and we definitely want to use the trainer model, so we train the subject matter experts that you have in each group or department, and then have them really train the end users on best practices and how to use Tableau.
Lastly, we follow up the migration launch with promoting Tableau, and that’s reinforcing some of the concepts we did in the training through lunch and learns, or maybe having Tableau days, which are really popular. At the end of the day, I think the goal is to establish a center of excellence, where you guys are setting best practices and standards for your organization on how you want to do analytics, especially using Tableau.
I mentioned the object inventory assessment a couple times, and this is how it works. A lot of Legacy platforms have some sort of metadata repository where they store all the information, usage statistics, things like that, about the reports. All this information is either in a database which you can connect to via an API, or some sort of ODBC connection. You want to take this information. They might also have maybe a tool. Like a lot of the platforms have an admin tool or a usage tool. You can export some stats.
So you want to take all this data and compile it, and understand how many data sources, how many dashboards that need to be migrated over, and then start whittling it down and removing things that are redundant. You’ll be amazed at how many things are called temp or task reports, things like that. You want to filter all those out and get down to the critical reports, and then you meet with the business, and then start identifying which reports are those high priority ones for phase one, and which ones are for phase two.
So this is a process that we use. We have an accelerator that actually speeds up this process and analysis too, but this process of doing the object inventory analysis is critical in setting the scope of your migration. At a high level, this is what a migration looks like.
Again, I mentioned there’s two phases. The first part of the migration, phase one, contains the initialization, where we’re obviously reviewing the object list, setting up your Tableau environment, either Tableau Server or Tableau Cloud. We’re configuring security models, row-level security, things like, and then there’s a migration effort, right? We migrate those high-level priority-one objects. All the while we start the developer training, because we like to use a co-development migration model, where we’re working in parallel with your team to do the migration.
So get that developer training done up front, and then when you’re performing the migration toward the end, right before UAT, you of course want to train your subject matter experts and have them participate in the UAT process, and then of course, you want to train your end users right before launch.
After your phase one is done, there’s a support stabilization phase, and then you have your phase two, where you then follow up migrate the lower-priority objects and, of course, sunset your Legacy BI Platform.
I will note at the bottom there that one of the critical things we also like to mention is that you need to approach the migrations with change management in mind, so change management is really critical and important to notify users about what’s coming down the pipe, all the benefits of this process, why you’re making this change and investing in a more modern BI Platform, and just keep them involved during the process, so that’s something I would note as a recommendation.
In closing, I just have a couple of recommendations that we found through our experience with doing migrations. First of all, I would say, in our experience, that 60% to 80% of all reports and dashboards don’t need to be migrated. We get asked this question all the time, like, “How much needs to be migrated?” It really is probably 60% to 80%. I know that number sounds high, but again, you’d be surprised how many reports are archived, or dated, one-off reports, test, duplicates even. That number is pretty high, so don’t be surprised. When it comes to personal reports, it’s even higher. It’s about 90%.
A lot of times, and this is just a pro tip, we don’t even migrate the personal reports. We ask that the users do that as part of either the UAT or part of their training process, and that, again, reinforces some of those training concepts, so just a little tip there that you can use when you’re planning your migration.
One thing I want to stress also is that when you’re doing your migration, you want to avoid a total lift and shift strategy, right? You want to reimagine your solutions using Tableau, and you don’t want to do a lift and shift. You definitely want to migrate in two phases, that high priority, and then everything else, and then lastly, you want to focus on performance and scalability, and if you have to implement like a high-availability multi-node Tableau Server, or maybe moving to Tableau cloud, you want to make sure the new system is scaling for performance for your end users, and you want to use certain caching strategies to reduce load on your back-end systems.
If you are using a subscription or bursting approach today with your Legacy platforms, which we know a lot of us do, using like Excel Bursting, things like that, I would strongly consider re-evaluating that. A more modern way of doing it now is pulling people into the application, pulling them into Tableau so they can do those analysis there.
Lastly, I would touch on and stress again the importance of change management. Keep your business informed at all times, and let them know the process as you’re going through it so that you have better user adoption at the end.
So with that, I’ll close just on a couple of things to consider when you’re doing your migration from a Legacy BI Platform over to Tableau. You definitely want to quickly identify your Tableau champion. Find a sponsor that is really going to be that sponsoring organization that really promotes Tableau. You want to conduct POC, obviously, to evaluate Tableau. I think that’s great to identify your success criteria upfront for any current or future use cases.
Do a TCO and ROI analysis. That’s something where you then better understand the financial impact of moving to Tableau, and then you want to do a thorough migration plan with both your business and IT stakeholders. You want to keep both part parties involved during the entire process so everyone’s on the same page about the expectations and the timelines for the migration.
Lastly, you want to plan your migration accordingly. Especially if you have a maintenance renewal coming up, you need to work backwards from that so you have enough time to test the system and make sure you sunset it accordingly, and I will stress in closing, avoid a lift and shift strategy. It’s best to reimagine everything in Tableau, and leverage the platform.
So that’s all I have. If anyone has any questions about what the migration process is, and maybe what is the best approach for you, please feel free to reach out. Here’s my contact information, and with that, I will turn the floor over to Kelly Schmidtle [phonetic], who’s the director of Business Intelligence over at P.F Chang’s, and Kelly is going to share with us their experience and their journey with their migration from MicroStrategy over to Tableau.
So, Kelly, I’ll turn it over to you.
>> KELLY: Thank you, Chris. One second, let me get my screen to come up. I think we are good. There we go.
All right. Good morning, everyone. I’m Kelly Schmidtle with P.F Chang’s, and I’m excited to share a little bit about our BI journey today of why and how Tableau has became an integral part of our BI strategy and our organization.
First off, I hope everyone on the call today has had an opportunity at some point to dine with us at one of our restaurants, and if not, you are in luck, because we are open today. If you are not familiar with our brand, that’s OK too, and, no, we do not sell samurai swords, although that would be pretty cool.
We are an Asian-themed restaurant chain. We have 300 locations. We’re in 25 countries. We are celebrating our 30th anniversary this year, which is awesome, and we also have a CBG product line, so you will find us in many grocery stores across the country, and we hover right around 15,000 employees.
So first off, what was life like before Tableau? So I want to start a little bit about where we were, and life before tableau, I have to say, was quite boring. We had a mobile app that was out there that was used at the restaurants and within the corporate level. It was a fantastic idea, but the execution maybe didn’t go so well.
We have some dropdown menus there and menus on the side. You would go and click something, and you would get that spinning wheel of death, and two, three minutes later, you might get something to actually populate, so next step would be to actually throw your iPad out the window because you were so frustrated at your experience.
If you look at the bottom left chart there, there are many charts that we had that had four or five different metrics on it. I think even if you were the genius of the organization, it’d take a little while to figure out the relationship between some of these metrics and what exactly it was trying to tell you.
On the right hand side there, you can see the basic table and reports that I think everyone’s familiar with. This is even probably a step down from Excel, it looked like. No colors, nothing there to really tell you what was going on, what you had to focus on, and really, it was hard. What is this telling me? And it was just not a great experience.
Right about this time is actually when I joined P.F Chang’s, and the idea was, “Can we turn this ship around?” “What do we need to do with our BI strategy to get a better user experience and make it better for the business?”
So what was our initial strategy? We actually had no intent to migrate to a new tool, and the idea was, “Hey, you know what? We have a tool already. We’ve spent the time, effort, and energies on this tool. Let’s make it work for our organization.”
So we said, “OK, what do we need to do?” We wanted to increase a lot of the customization. We wanted to improve the report experience? And, for myself, how do we get our arms around this beast and really understand who our users were, what the users were actually using, what the users need that they didn’t have today, and if we’re going to stay on the tool that we had, we want to make sure that it was operating at optimal performance, and so were we on the latest version, and were any upgrades required to the tool or to the architecture itself? And wanted to make sure that we did everything possible that was going to allow what we had to work in an efficient manner.
So one of the first things that we did, which Chris actually touched on, is, I think migration or not, this is a great exercise, and we went around and we went to all the business users, we went to the people writing reports, we went to the different business groups that we had in different departments, and we said, “OK, what reports do you have out there?” “What do you actually use?” We exported a lot of the objects and stuff from the environment to see when they were last used, who was using it, how often it was used, et cetera.
We did a couple of rounds of this over a couple of months. It took a little while. On the first round, we deleted a couple thousand reports and a few thousand metrics. I was, like, mind blown, right? Like, “This is great. We’re making good headway, we’re going in the right direction.” And we also cleaned up the overall hierarchy and folder structure that we had out there. We organized things by department or by user groups, and things were looking really nice.
So what happened? We still had systemic problems out there. One, which I think is probably the main thing, is the entire tool that we were using lost credibility. Nobody wanted to use it, they didn’t have a good experience, the performance was poor, and so anytime you mentioned the word of what we had, nobody cared, so people weren’t getting the information they needed, and they weren’t able to make the business decisions that they needed to make in order to help the organization, and our business leaders were frustrated. They had nothing to use, they had nothing that they could rely on that was trustworthy to get them the data that they needed.
So that was a huge problem for us, and I think that getting credibility back and that trust back is very difficult to do once it is lost. We had a very steep learning curve. It wasn’t easy to know what cube to go to for what data. If you were a developer, they couldn’t get to the definitions of the metrics, maybe because of permissions, and so they were experiencing all kinds of issues along the way that made it even harder.
On top of that, we had problems on the backside which weren’t really tool related, but as you guys know, if you’re developers or in the BI space, if you have a problem with your data, it’s inherently a problem with the tool itself. It doesn’t matter if it came from the database side or not.
We had net sales, the naming of our metrics, right? Net sales new or latest. That might be a little more prevalent in people’s folder structures, where you say, “This was my oldest,” whatever, so I would actually search, or you would search for net sales, for example, and you would have a ton of options, and nobody knew what to pull.
I remember actually going to a business user and saying, “Hey, how do you know what net sales to use in your report?” And they said, “Oh, I use the second one down”, and I’m like, “OK, we’ll, why?” And they would be like, “Well, it most closely represents the number I think it should be”. I was like, “Well, OK, I guess. That sounds like a big problem.”
So we had to fix some of this data quality and governance side stuff on the backside as well, and of course we had misspellings all over the database. Like you can see physical calendar, for example, which made its way through all the reporting, and things like that, which are very easy to clean up initially and should not even exist.
So what was our next step? We could stay with what we had. We could add an additional tool to our toolbox, which didn’t make a whole lot of sense for us, or we could go with something completely new. The main question, I think, or the first question that everyone asks when they’re deciding on new software or something is, “Hey, what is this going to cost me?”
So of course that’s something we considered, and there’s tools out there that cost more than Tableau and there’s tools out there that cost less, right? We wanted to make sure, “We’ll, what other value do we get if cost became an issue or whatnot?” And to be honest with you guys, the cost for us was basically the same, so we didn’t pay any more or less than what we had, so that was actually a plus for us, and we actually also have some add-ons from Tableau, like Tableau’s data management, which we have subscriptions to for all of our users as well, which is great to track data lineage and some of those types of things.
We also didn’t overthink this move either, right? We needed something that was easy to support, easy to use, easy to develop, and of course we wanted to see what other organizations were using out there, so we wanted to make sure we were within at least the top two or three contenders of the tool options that were there.
Now, I wanted to point out just a couple of out-of-the-box things that people might not think about, which is, if we’re migrating to a new tool, I wanted to think about the talent pool, right? What if I had to make changes to my team? What if I had to recruit new people to the team? How hard was it going to be to find people that already may be familiar or had the skills needed to come on board?
The nice thing is the top two contenders here, you know, Tableau, of course, is being taught at schools and universities and colleges, so if I need a junior person, I thought that was fantastic, and we actually hired someone out of college because they had Tableau in their coursework and stuff like that, and it worked out great.
The other thing on the support side is, the community is very important, because as much as I love Tableau support and putting in tickets and things like that, I don’t want to have to rely on them all the time. I want to find answers myself, so to do that, it was important to have a tool that had a very large community out there. Not only that, a community that’s willing to help people and help find answers.
So I use Tableau community all the time. It’s great. I’m out there in the forums, I ask questions and I’ll get answers, generally, same day, and sometimes there’s two or three different options or answers, and I also want to throw out that Tableau public is out there and we use that as a source as well, just to get chart ideas and different ideas to picture the dashboards and things that we can use on there and new chart ideas, and it has to be easy to use.
A lot of our users are in the restaurant, right? So their expertise, they’re not sitting at a computer all day. They’re at the walk and ladles, and their expertise is in cooking and that kind of stuff, and running a restaurant, not necessarily going through dashboards and data, so we needed something that someone can go in and just point and click, and very little training, and be able to get the data and information that they need.
Then, of course, on the development side, we had to have something that was easy to learn, didn’t take that long, and I wanted something within an hour or so, which is kind of what happened with Tableau, that people could be off and running and doing their own basic charts with very little guidance or training, which was great.
So what the migration look like for us? Well, I had this great plan: “We’re going to take five months. I think we can do it, but that’s probably a tight window.” And the business came back and said, “OK, you have two months.” And it’s, like, “Oh, OK, maybe we can do this.” And so not only that, the two months happened to be November and December, which is everyone’s favorite month because nobody’s around and it’s holidays, and so we really had a little bit of pressure here to get on Tableau if it’s something that we wanted to do, which it was, and that’s what we chose.
Although, at the same time, we’re starting this new data warehouse and we’re also migrating to workday for some HR and our accounting pieces of the business, so we stood up a server. We are On-Prem. You have the option of On-Prem and on Cloud. We chose to do On-Prem, initially. We might migrate to the cloud here, eventually, within the next year or so, so we had a server up, and going and playing with this thing, and starting to do project structures and things within really the same day. It didn’t take long at all.
Of course, we spent some time ironing out all the permissions and Active Directory groups and things of that nature, which took a little bit longer, but the initial setup was great. It was super easy with the help of our infrastructure team. Not only that, we decided to throw out everything that we had existing, so we did not want to carry anything old over to our new, bright, shiny system and new server. We wanted to make sure we started over, and we just grabbed some of the old core reports, which I think Chris touched on a little bit here, is we just said, “What are our primary reports?” “What does the business need to function?” We started with that, and that’s what we developed first, and then we ended up going, “What are the nice to have” kind of thing?
Of course, none of this is possible without having the proper support, so business leaders, XeoMatrix come in for a couple of weeks. Tableau themselves, account managers were great. The community, we touched on, and then, of course, none of it’s even possible without your IT support, right? Infrastructure, database teams, the data integrations, that side of things is absolutely critical to make this successful.
So what were some of the benefits? A lot of the benefits, we figured we would get, but there were also a couple of things that we had no idea until it happened, so the first bullet there is we found out that a lot of our external business partners were also on Tableau, so this was great. They shared data sources, they would share their workbooks. I actually took one of our external business partners workbooks and published it to our server and shared it with our organization that way, so there was a lot of cohesiveness there with our business partners because they were also using the same tool, so we were able to utilize that.
A couple of big things, which is where I mentioned that cost wasn’t that important for us initially because we have the cost savings elsewhere, and one part that we saw a lot of return was, of course, on the support that it took now to support Tableau versus what we were on, so we removed half of our offshore support, and we reduced our onshore consulting down to nothing, so we got rid of all of our support that we had in house here at our headquarters, which was a huge cost savings to us.
The other big benefit that we got was turnaround development time, so when we wanted to make changes to that app initially that I shared, it would take four or five weeks sometimes to get through the process to do simple formatting changes and things like that, and it still didn’t work in the end. It was garbage, quite frankly, because nobody used it.
So we saw a significant improvement when we moved to Tableau from that four or five weeks down to same week, if we had the data source. Potentially same day turnaround time, depending on what was required, and because we had this new tool that was actually working for us, and it was faster and better, we got more requests from the business, so more requests from the business actually moved into the user adoption increasing that was enormous for us, right? We had something that didn’t really work, that people didn’t like, and then we moved to something that was working for us, was performing for us, people were liking it, and they wanted to use it.
So it’s wanting to use it, and then part of that initial where we went through and talked to the departments about what we could get rid of when we were migrating to Tableau actually helped us in this department, too, because we got to know what people needed, what they wanted, so we could go back to those user groups and say, “Hey, can we help you develop this?” We know you brought it up when we were going through your reporting. It’s kind of an organic growth, so people started coming to us and saying, “Hey, we have these data sources. Is this something you can now bring in and utilize in Tableau?” And we’re, like, “Absolutely.” We’re not going to turn down the work, right?
So we improved the trust in the data, the user adoption, of course, the self-service and the learning curve shrunk down significantly.
Our FPNA group, for example, are all on Tableau desktop, and developing their own reports, and doing their own thing now, which is awesome, and so we had a lot of increased efficiencies, and of course access to more data sources. There hasn’t been a data source yet that we haven’t been able to pull into Tableau that we’ve wanted to analyze.
So where does that put us? We use Tableau in a lot of areas, but I just wanted to point out a few of them because they’re a little bit maybe out of the box too.
Accounting, for example. We utilize Tableau in some tax reporting. I don’t know how many people use Tableau for tax reporting right now, but we found that our tax team was spending thousands of dollars to an external partner to do some formatting and put a tax report together, so we said, “Hey, let us take it out of that.” And we put it in Tableau. We use some Tableau formatting and custom formatted this thing, so now our accounting team can export that, submit it right to the IRS, and they are good to go.
Another thing that we did recently is, we did this Invoice repository, so we made a frontend of Tableau, so our accounting team can do a search by Invoice or supplier number or by date, and then through Tableau’s URL action, they can click on that Invoice, which brings up a PDF for that Invoice, and they can do their reconciliation or whatever, and this was another process where our accounting team was paying a third-party vendor to house our invoices, and do all this thing, and we were paying thousands of dollars a month.
So, again, this is another cost savings that came about by using Tableau and just finding a new way to use that tool. We also use it throughout our leadership for daily Flash reports. A lot of companies out there send out Flash report to leaders in their organization and other people that need to know, you know, what was yesterday’s sales and performance, and all of that kind of stuff, so through Tableau subscriptions, we send all of that out to those people, which is phenomenal as well, and a lot of those people actually don’t even use Tableau server. We just use Tableau to send subscriptions out to those people. That’s all they need, that’s all they want, and it works great.
We do a lot of mapping, guest satisfaction, so we have all kinds of data sources. A fun one that we have out in the field with our restaurants is, a lot of our restaurants have contests with the servers or employees, so for example, if a new menu item comes out, they want to have a little contest for who’s going to sell the most whatever. We track that in tableau. It creates a little bit of competitiveness, and of course the more sales, and it helps the business as well.
So we also have a lot of opportunities still, and we’re targeting other areas of our organization. Right now we’re currently working in Culinary. We’re doing a project for Service Desk, and we just have a lot of others that we can tab, so we’ve been on Tableau for a little while now, but we’re still moving our way through the organization and continuing to get that adoption, which is great.
I just wanted to share a couple of examples here, so the one on the left, and these are kind of partial dashboards that I pulled… I wanted to illustrate Tableau’s powerful map layer features that they have, where you can add multiple things on the same map, so what you’re looking at here on the left, you know, the red fork and knife is actually one of our restaurants. The blue circles represent Uber Eats, Grubhub, those types with people for delivery. The orange circles represent if our orders were delivered by a P.F Chang’s employee, so we can see that, and then we brought in geospatial data, which Tableau obviously allows us to do, which is the polygon.
So that the wider blue one there is, “If you order or spend more than $100 with us, hey, we’re going to drive a little bit farther out to deliver that order.” Whereas if you order less than $100, then we’re going to stay within that green polygon there, and we’re only going to drive out that far, so this allows us to quickly see and visualize, “Do we need to change these areas at all?” “Do we need to expand?” “Do we need to contract?” And how do we need to handle our delivery areas? And the part that you’re not seeing here on this dashboard is, we actually have a little slider and tool where we can see the percentage of orders out, one mile radius, two mile, three mile, et cetera, so we can do a lot of extra analysis here to really figure out what’s happening with our delivery.
Then the example here on the right is, we take all of our social reviews, so from Google, TripAdvisor, Facebook, Yelp, et cetera, we bring all of that data in, we bring it together, and we can quickly see here, you know, you see that line chart on the left that our average reviews per restaurant have been going up, you know, 74% are five star reviews, and then the right hand side there, is we’re improving our average rating per restaurant or for all our restaurants, and we maxed out there in March at about like a 4.6.
If you remember, I kind of shared that app there at first. Here on the left hand side here is what we call Curiosity, and that’s what our iPad app was called. It just didn’t work for us, and this actually was the first dashboard that we built at P.F. Chang and brought over, so some people might say, “Oh, it doesn’t look like much. You could add a little more flair or whatever.” And that was my first thought. It’s like, “Hey, we could really do a lot with this.” And business users were like, “No, this is what we want.”
So I think it’s very important when you’re doing this or you’re building reports, is listen to the users, right? Like, this report is not for me as a developer or someone that’s building this. It’s for the business and for our users, so if they want something a specific way, sure, I can give my input on what could be better, or a different chart, or whatever, but if it’s not what they want, then they’re not going to use it, and this is actually our most used Dashboard in the company right now. We have plans to revamp it, but at the same time, we’re hesitant, because people are using it the way that it is, but we want to add some extra value there, so we’re working with the business. We’ll go back and talk to them and see what we can do here.
Then the one on the right, I just wanted to kind of show that we put a scatter plot there, and we made the four quadrants, and this is for our loyalty-subscription program that we just started a few months ago, and the circles are some of our restaurants, not all of them, of course, and we can see down at the bottom we have enrollment count, and then up the side there on the vertical is the renewal count, so we can easily and quickly see who has the most renewals and the most enrollment of our subscription program, and who might be down in that bottom left quadrant that might need a little extra help. Or we can figure out, “Hey, what’s going on with subscriptions? Are you guys not from promoting it? Or are you not mentioning it to guests?” Like, “How can we improve that?”
So that’s a little bit of the examples on how we use these things. I know that was pretty quick, and I think I might be a little overtime, but just wanted to thank everyone for jumping on the call and sharing their morning with us, and want to thank Tableau and XeoMatrix for giving us the opportunity to share a little bit about our story. I think we have a little bit of time for Q and A, so I think I’ll send it back to, I guess, Chris or Courtney.
>> COURTNEY: I will take that virtual mic. Ian, Chris and Kelly, thank you so much for the time and energy you put into the session for all of us today.
If I’ve learned anything from the last five to ten years, it’s that technology and digital transformation waits for no one, so in order for our customers to stay successful in this industry, we must be able to adopt and adapt and continuously innovate, and after this session, it’s pretty clear that modernizing a Legacy BI platform is a smart and natural first step.
So we have about six minutes. We have a few questions that we have time to dig into. A few of them had trickled in while we were doing the presentation. I know you may have hit on some of these already, but it never hurts to reinforce some of the burning questions.
First off, the one that popped up the most. Now, Chris, I know you touched on this. We know that migration is not a one-size fits all for our customers, and they have different migration plans and needs. Now, I know we mentioned do not just rip and replace, really emphasize and take advantage of what Tableau has to offer when you’re doing these migrations, but in your experience, do you see customers going all in for a full migration right out the gate? Or is it more common that they opt for a partial migration over time?
>> CHRIS: Probably more commonly is the partial migration, to do it over time, but I would say a close second is that total migration, especially if it lines up with a license renewal of some sort, so it’s close to 50/50, but, yes, usually, people, especially larger organizations, try that partial migration and do it in phases.
>> COURTNEY: Oh, it makes sense. Thank you so much for that, and what is the typical length of a migration, if you could remind us? I know it would change based on company and business size and data and all that jazz, but typically, what do you see?
>> CHRIS: I would say the migration effort itself for a mid-sized organization might take around probably three months or so, and, obviously, with larger organizations, it might take longer when it’s more of a phased approach. We still like to keep our development times around three months, so it’s a little more agile, and so you do the phases every three months, so that’s sort of around what we see.
Kelly, your experience, I guess, you said it was two months, right, for you guys?
>> KELLY: Yes, we had two month, and then because it was a hard deadline, January 1st, we were moving our data warehouse. We were moving to work day as well, so we didn’t have a choice. We had to make sure that we were up and running in two months.
>> COURTNEY: Beautiful. No, that’s great. Talk about a motivator. I’m going through these questions quickly. I just want to hit on them before we end. OK. We know that in a perfect world, every customer would have endless headcount bandwidth and budget to just have the all-star IT team to run their migration, but that’s not really our reality for most of our customers, so can I ask you, Chris, from the bare minimum of what a company would need for an IT team to do a migration, and the ideal of an IT team, what would that look like in order to actually get this migration?
>> CHRIS: I think maybe bare-bones would at least be maybe a lead, and maybe a developer to work together in doing the migration effort themselves, and then having maybe someone on data engineering that could support you in case you need to make some adjustments on the backend data warehouse.
Ideally, you’d love to have project management around that as well, so a delivery manager as well, and for larger implementations, maybe a second developer, and of course, you want to include the business, too, right? It’s not just about IT.
Kelly, can you explain some of the structure of your team?
>> KELLY: Yes. That sounds pretty much right on to what we had. We utilized our infrastructure team, obviously, to get things set up because again, we’re On-Prem, so we had some server stuff and work that needed to be done. We obviously leveraged our data team for data sources, and things that we had to make adjustments to.
My team, we had the advantage of a little bit of offshore that was kind of a spillover from what we had with MicroStrategy there, so we had plenty of developers, and then right out of the gate, too, where you talk about business support is, we had our FPNA team all on Tableau desktop, so we had a lot of extra hands there to be able to help us on that development side and turn reports out as needed.
>> CHRIS: That’s awesome.
>> COURTNEY: Very awesome. One last question to wrap it up, and I think it fits well with P.F. Chang’s experience, is Chris, if there are any, what are the ways to speed up a migration?
>> CHRIS: You know, there’s two areas during the migration you can speed up, and we have some accelerators around this. One is in the object inventory assessment that I mentioned, right? So we have a framework or accelerator that helps identify those objects quicker, and then also during the migration, although I would say it’s not a lift and shift, but there are parts of this that you could automate, like some of the creation of the data sources, things like that, so you can add some automation to the migration effort itself.
Kelly, do you have any other tips or things that might help accelerate migration?
>> KELLY: You know, I think the one for us, nothing speeds it up more than a deadline coming from the C suite.
[laughter]
>> CHRIS: Good way to put it. Yes. All right. That’s a great way to end it, for sure.
>> COURTNEY: Absolutely. We have one minute to spare. Thank you all for joining.
I just want to remind everyone that this session was recorded. It will be socialized internally at Salesforce, but we’ll also be giving all of our panelists today their own copy of this webinar. They can host on their websites, use later on, so even if you did miss it, or this was your favorite episode and you want to watch it again, it will be available on demand.
With that, I will thank everybody. Enjoy the rest of your Wednesday, the rest your week, and as always, Ian, Kelly, Chris, it’s been a pleasure. Thank you all so much.
>> CHRIS: Thank you, everybody.
>> KELLY: Thank you.
>> COURTNEY: Bye, everyone.