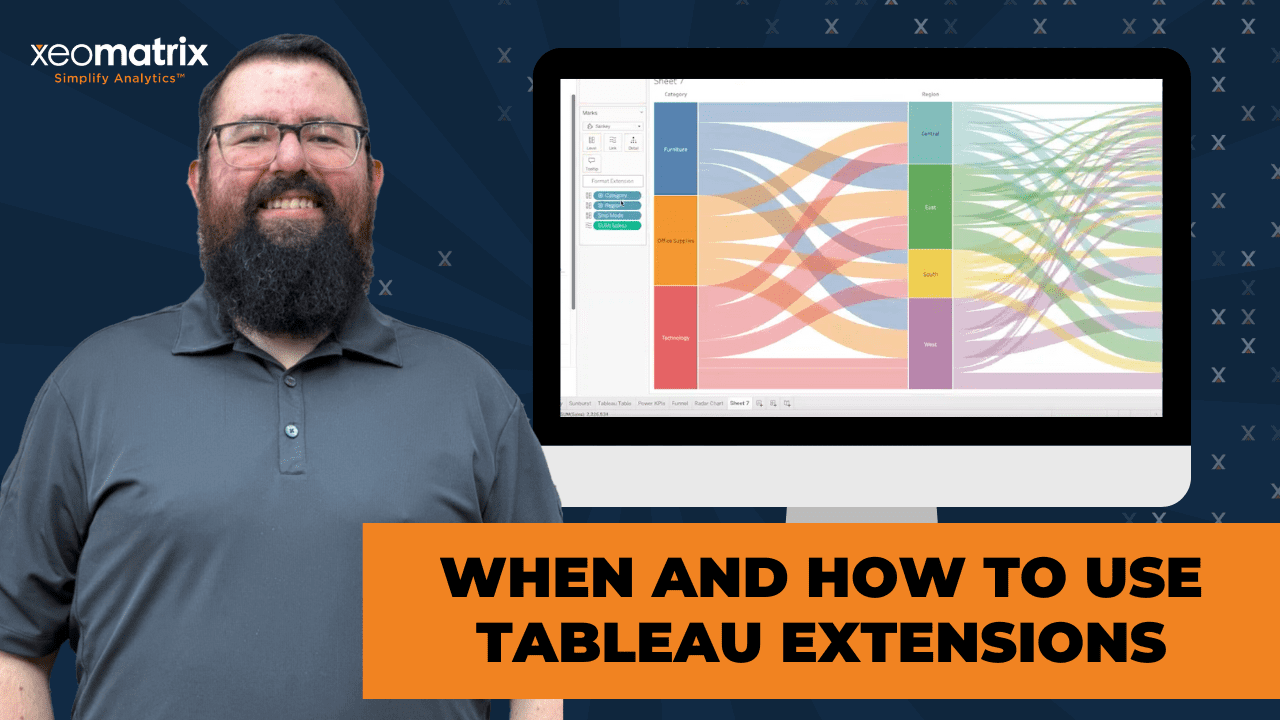
mobile device-specific dashboard in tableau

Device-Specific Dashboards In Tableau

Tableau makes it easy for users to create device-specific dashboards in Tableau, and provides a wide range of device and screen sizes options. Users viewing published content on Tableau Online or Tableau Server will see a dashboard automatically adjusted to fit whichever device is being used. This feature was designed to give users the same…
data monetization white paper in a magazine style print

Data Monetization – Use Cases, Implementation and Added Value (Whitepaper)

This whitepaper, written by Dr. Sebastian Derwisch, is a survey-based study that offers insights into how European companies are approaching data monetization.

shared axis dashboard with green profit data field and blue sales data field

Dual-Axis vs. Shared Axis In Tableau

Tableau allows users to create a wide variety of visualizations within a dashboard. When you want to understand the relationship between two measure values in Tableau, you can use a dual-axis or shared axis view. Both visualizations show relationships, but they do so in different ways depending on the measure values you need to understand.…
top down view of the Adding Value WIth Emmedded Analytics Whitepaper showing the cover and some interior pages

Adding Value with Embedded Analytics (Whitepaper)

This whitepaper, written by Michael Kovner, Product Manager, and Tracy Rodgers, Product Marketing Manager, at Tableau provides guidance for embedding Tableau within simple web pages, custom web portals, 3rd-party applications, and customer-facing products. About the Whitepaper Business moves fast, and managers and decision-makers can’t wait days, or even hours, to view data and analyze the…
tableau tips and tricks

Click and Drag to Create Duplicates in Tableau

We at XeoMatrix have gathered a few tips & tricks that can make your Tableau development experience even more efficient. Today's topic is: Click and Drag to Create Duplicates. To easily create a duplicate image, icon, chart, or graph in your Tableau worksheet, you can use the control, click, and drag shortcut. We've created an…
tableau dashboard displaying donut chart

How to Make Donut Charts In Tableau

Donut charts have begun to replace Pie charts in data visualization. While they provide a similar level of detail or insight into data, the Donut chart has become best practice. To learn how to make donut charts in Tableau, follow our step-by-step tutorial below. What Is a Donut Chart? A donut chart is very similar…
embedded analytics dashboard on a laptop

3 Tips for Embedded Analytics Beginners

As business continues to move online, data has become an increasingly important metric. Whether you are collecting data from social media, website conversions, advertisements, or email newsletters, you need to understand it and leverage it to make decisions. This is where embedded analytics can help. If you're haven't already taken the plunge with embedded analytics,…
tableau tips and tricks

Add Data from an Online Source in Tableau

We at XeoMatrix have gathered a few tips & tricks that can make your Tableau development experience even more efficient. Today's topic is: Add Data from an Online Source. If you want to add data into your Tableau worksheet from an online source, you can easily copy and paste it. Let's say, for example, that…
example crosstabular dashboard view in tableau

How to Remove Grouping from Crosstabs In Tableau

Tableau creates crosstab groups in order to help us quickly understand data. However, these groupings are not usually the best way to present visual data to an end-user. In this article, we will teach you how to remove grouping from crosstabs in Tableau. What Are Crosstabs in Tableau? A crosstabular view in Tableau shows detailed…
broker portal sales funnel dashboard

What Is Modern Business Intelligence?

As the pace of business continues to accelerate, business intelligence has quickly evolved to meet the needs of data-hungry users. Modern business intelligence tools have opened the door for self-service analytics and brought data reporting to the mainstream. But how do you know if it's time to make the switch to a more modern set…
Subscribe

Join our list to receive data analytics tips and tricks in your inbox.

  • This field is for validation purposes and should be left unchanged.

Need help simplifying your data analytics?

From Tableau training and support to custom dashboard design and embedded analytics, find out how XeoMatrix can help you optimize your business intelligence and data strategy.

Contact Us To Get Started