
About the Topic
Presentation Video
Summarized Presentation
Tableau Prep begins with importing data and sequentially applying steps to clean and reshape it. This foundational process is pivotal in ensuring the data aligns correctly for analysis. The initial ‘Clean Step’ is crucial for exploring and validating data, allowing for an interactive and strategic approach to understanding and managing data quality. This step sets the stage for the efficient handling of complex data flows, providing a cornerstone for subsequent data manipulation.
The Union step is instrumental in consolidating fragmented datasets. Tableau Prep offers intuitive methods for creating unions, ensuring ease in combining data from diverse inputs. It adeptly handles field mismatches and standardizes data formats, essential for creating a cohesive dataset. Joins, on the other hand, are pivotal in merging datasets based on common attributes. Jared’s example of joining orders and returns illustrates the nuanced considerations in join types, field selection, and data cleaning, culminating in a refined dataset ready for in-depth analysis.
Pivoting, as demonstrated by Jared, is a transformative process that realigns data for enhanced analysis. Converting years from columns to rows, for instance, optimizes data structure for better interpretability. Aggregation, another critical step, involves grouping and summarizing data. Jared’s approach in aggregating sales, quantities, and profits, and in joining this with quota data, underscores the importance of this step in creating a comprehensive and insightful dataset.
Tableau Prep offers flexible output options to cater to diverse needs. Users can export data to their local machines in formats like TDE, Excel, or CSV. Alternatively, data can be published to Tableau Cloud or Server, benefiting from centralized access and data management capabilities. For Salesforce users, exporting to Salesforce Data Cloud or CRM Analytics integrates data preparation within their ecosystem, streamlining their workflows.
Presentation Outline
- When to use Tableau Prep
- Building out a Prep flow
- Clean Step
- Unions
- Joins
- Pivoting
- Aggregate Step
- Output
When to use Tableau Prep
Tableau Prep is recommended for scenarios where you need to manipulate data structures, especially when dealing directly with source tables like Salesforce, which can be complex. Tableau Prep serves as a light ETL (Extract, Transform, Load) tool, suitable for creating clean, combined data sources from various tables or spreadsheets.
It’s important to structure and prepare data to make it more insightful for decision-making. For example, when dealing with sales data from different roles, Tableau Prep can simplify the process by aggregating names from various roles into a single ‘sales team member’ field, making it easier to attribute revenue shares accurately.
Building out a Prep flow
Creating a flow in Tableau Prep involves importing data sources and then applying a series of steps to clean and shape the data. This process is vital for ensuring that the data is in the right format and structure for analysis.
Clean Step
The Clean step in Tableau Prep is a fundamental starting point for any data preparation process. As emphasized in the seminar, immediately after bringing in an input step, it’s advisable to add a clean step. This approach is not just a procedural habit; it’s a strategic move for efficient data management and exploration.
When you incorporate a clean step, it enables a detailed examination of the data. This exploration is crucial for understanding the structure and quality of the input file. The interface shows different values in each field, and dark gray bars represent the frequency distribution of these values. This step isn’t just about observing data; it’s also interactive. You can scroll through and click around to explore various aspects of your dataset.
Another significant aspect of the clean step is its role in data validation. This process is essential for ensuring that the data you’re working with matches your expectations. For instance, if you’re analyzing sales data, you might want to confirm the presence of certain product categories or sales figures. The clean step allows for such validation through its interactive interface. You can also apply filters at this stage, although it’s usually temporary.
One of the most practical benefits of starting with a clean step is its impact on managing complex data flows. If your flow has multiple branches stemming from a single input, incorporating a clean step at the beginning simplifies future modifications. For example, if you replace the initial input step, you only need to reconnect the new input to the clean step rather than each branch individually. This setup significantly reduces the time and effort required when your data sources or structures change.
Unions
The Union step in Tableau Prep is a critical tool for combining data from multiple sources into a single dataset. This step is essential when dealing with fragmented data that logically belongs together.
There are two primary ways to create a Union step in Tableau Prep. The first is by directly clicking and adding a Union step from the end of a Clean step. Alternatively, for a more streamlined approach, you can drag one step onto another. If you drop it below another step, the option to Union them appears. This feature simplifies the process of combining datasets from different inputs.
Once the initial Union is set up, adding additional inputs is straightforward. You can drag another input to the existing Union, and place it on the left, right, or below to add it seamlessly. This flexibility is crucial for dynamically adjusting your data flow as new sources are included. It’s important to note that once the first union is created, you’re essentially adding to this union rather than creating a new one each time.
One of the challenges in creating unions is dealing with mismatched field names across different inputs. For instance, ‘Product Name’ might be present in three of the input tables, while the fourth table has it listed simply as ‘Product’. Tableau Prep’s Union step allows you to resolve these mismatches. By clicking on a field, Prep suggests matching fields from other inputs, which you can then combine by clicking the “plus” button.
Ideally, in a Union, the column names across all inputs should be the same. However, if they aren’t, the Union step provides options to clean and match these fields. For example, if one input has ‘Discount’ and another has ‘Discounts’, you can unify these into a single field. Similarly, if the date fields are separated into year, month, and day in one input but combined in another, you can use calculated fields to standardize this data before the Union step.
In cases where certain fields are not directly aligning, such as differing date formats or missing regions, you can return to the Clean step to create calculated fields. For example, if the ‘Region’ field is missing in one input, you can create a calculated field to fill in this gap, ensuring that when the data reaches the Union step, there are no discrepancies.
After resolving field mismatches and standardizing data formats, you might find certain fields redundant, such as individual components of a date that has been consolidated into a single ‘Order Date’ field. In such cases, it’s efficient to go back to the Clean step and remove these superfluous fields, streamlining your dataset post-union.
Joins
In this section, Jared showcases the process of joining data using a specific software platform, emphasizing the critical steps and considerations involved. The focus is primarily on joining two sets of data: orders and returns, which he approaches by first deciding between union and join options. Opting for a join, Jared initially sets the system to automatically join on “product ID.” Recognizing the need for more detail, he also includes “order ID” in the join criteria, providing a more comprehensive view of the orders associated with each product.
Initially, the join is configured as an inner join, which matches 621 rows from “clean five” (orders) and 272 rows from “clean seven” (returns). However, Jared’s objective extends beyond just matching returned items; he aims to include items that were not returned as well. To achieve this, he changes the join to a left join. This modification includes rows from the orders that do not have corresponding entries in the returns, thereby encompassing both returned and non-returned items.
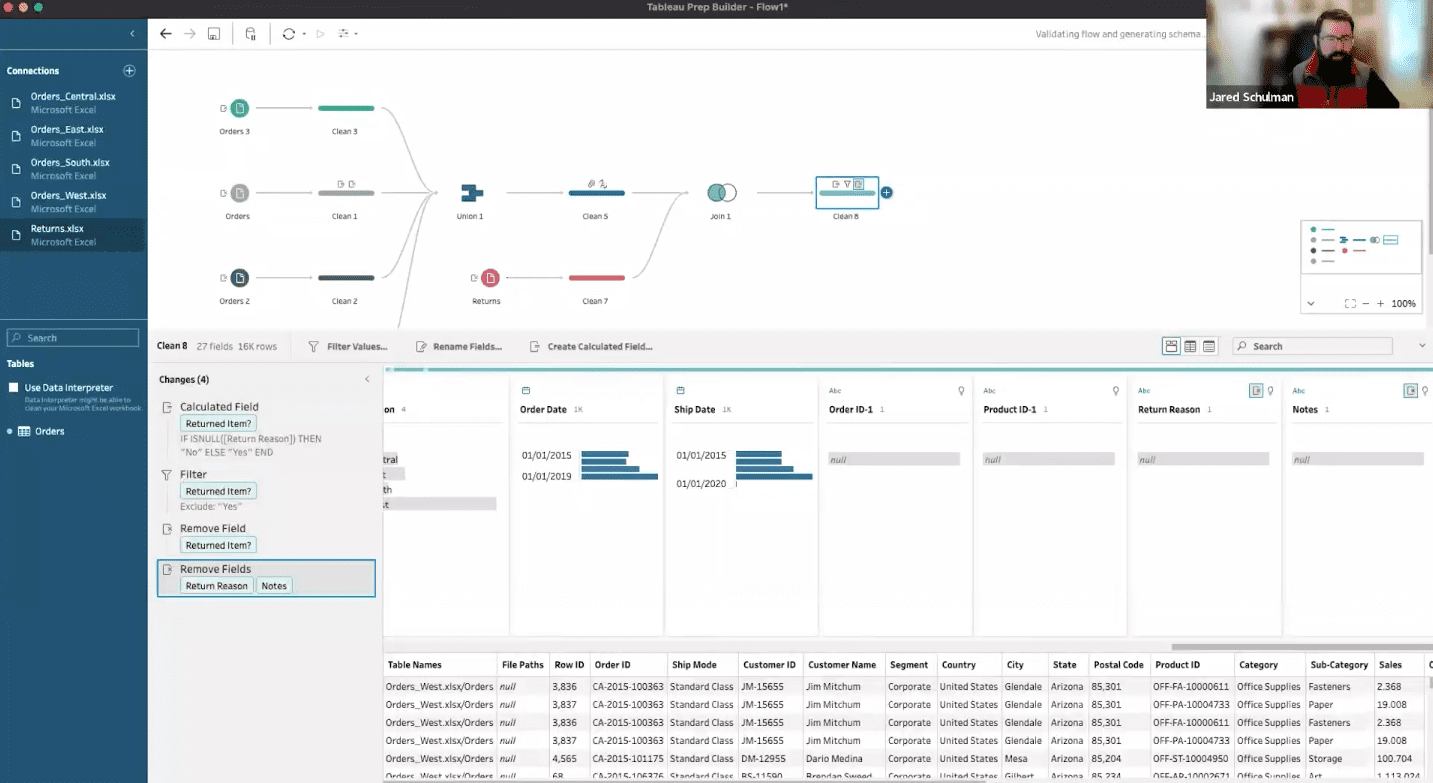
Following the join, Jared implements several data cleaning and manipulation steps to refine the dataset further. He introduces a “returned item” flag, a conditional field that identifies whether an item was returned based on the return reason. If there’s any return reason, the item is marked as returned; otherwise, it’s marked as not returned. He then filters out the returned items to focus exclusively on final sales. This process involves excluding rows marked as “yes” in the “returned item” field, effectively isolating the sales that were not returned. Subsequently, Jared removes the now-unnecessary “returned item” field and other irrelevant fields like return reason or notes to streamline the dataset.
A significant challenge in the join process is the emergence of duplicate fields, particularly “order ID” and “product ID,” which appear on both sides of the join. To address this, Jared searches for fields with a dash (“-“) to identify these duplicates easily. He cautions that the decision of which duplicate fields to keep depends on the join’s direction and the specific data requirements. In this case, since the duplicates coming through are null, he opts to remove them.
The final step in Jared’s process involves creating an output named “superstore sales.” This refined dataset includes all orders across four regions, meticulously filtered to exclude any orders that were later returned. The resulting data source is thus a cleaned and consolidated version, ready for more accurate and meaningful analysis or reporting. Jared’s approach to joins not only demonstrates technical proficiency in the software but also underscores the importance of careful data manipulation and cleaning for reliable data analysis.
Pivoting
Jared demonstrates how to pivot data from columns into rows, a common operation to restructure datasets for better analysis and visualization.
In this scenario, Jared is dealing with a dataset where years are represented as columns and the goal is to pivot these years, transforming them into rows. To accomplish this, he uses a pivot step, a functionality that allows users to pivot columns to rows or vice versa. In this specific case, the requirement is to turn columns (years) into rows. Jared selects the relevant year columns and drags them into the pivot function area. This action triggers the automatic creation of two new fields: “pivot one names” and “pivot one values.”
Jared clarifies the roles of these newly created fields. He renames “pivot one names” to represent the year, and “pivot one values” to indicate the quota for that respective year. This renaming enhances the clarity and readability of the pivoted data. After adding another clean step, the dataset becomes more comprehensible, showing clearly which year corresponds to which region and what the quota is for each combination of year and region.
This pivoting process significantly enhances the usability and interpretability of the data. By transforming the years from columns to rows, Jared effectively reorganizes the dataset, making it more accessible for analysis. The ability to quickly identify the quota for each region and year demonstrates the effectiveness of this method in simplifying complex datasets. This technique is a vital part of data preparation, ensuring that the data is in the most useful format for subsequent analysis or reporting tasks.
Aggregate Step
Jared moves to the core of the aggregation process. This involves creating a new branch in the data flow and preparing the data for aggregation by ensuring the presence of necessary fields like ‘year’ and ‘region’. The aggregation step itself is divided into two parts: grouping and actual aggregation. For grouping, Jared chooses to group the data by region and year. He points out that even numerical fields like ‘year’ can be grouped rather than summed, which is a common default operation.
In terms of aggregation, Jared explains how to aggregate different types of data, such as sales, quantity, and profit, by summing up these values. For other metrics like discount, he chooses to calculate the average rather than the sum, to provide a more meaningful insight. This aggregation results in a dataset that, for each region and year, shows total sales, quantity sold, total profit, and the average discount.
The next step involves joining this aggregated data with the quota data, ensuring data types match for a successful join. Jared emphasizes the importance of data type consistency, as mismatches between types like strings and integers can cause errors. After resolving these issues, the joined data provides a comprehensive view of quotas, sales, quantity sold, profit, and average discounts for each region and year.
This aggregation process is a critical component of data preparation, especially in business intelligence contexts. By organizing and summarizing the data effectively, Jared enables deeper and more actionable insights, facilitating better decision-making based on the analysis of sales, quotas, and other relevant metrics.
Output
There are multiple avenues for outputting data in Tableau Prep, catering to different needs and scenarios:
- Local Machine Output: Data can be exported as a file to the user’s local machine. The formats supported for this type of output include Tableau Data Extract (TDE), Excel file, and CSV. This option is suitable for users who need to use or share the data in a standalone mode, without the need for further online processing.
- Publishing to Tableau Cloud or Server: For a more integrated approach, especially in organizational settings, data can be published as a data source to Tableau Cloud or Tableau Server. This method not only allows for the centralized access of the data but also leverages Tableau’s data management capabilities. Users can utilize the data management add-on to schedule regular updates and processing of the data flow, ensuring that the data remains current and relevant.
- Output to Salesforce Data Cloud or CRM Analytics: This option is particularly relevant for users who work within the Salesforce ecosystem. It allows for direct integration of the processed data with Salesforce’s data cloud or CRM analytics tools, enabling seamless data analysis within the Salesforce platform.
- Publishing to Databases: Tableau Prep also supports direct output to various databases such as Amazon Redshift, Google BigQuery, Oracle, PostgreSQL, and more. This feature is particularly beneficial for organizations that operate with database-driven applications and systems. However, Jared cautions about the need for careful management of permissions when connecting to databases. There is a risk of overwriting production tables if proper precautions are not taken. It’s essential to ensure that access is securely controlled to prevent unintended modifications to critical data.