
Tableau makes it easy for users to create device-specific dashboards in Tableau, and provides a wide range of device and screen sizes options. Users viewing published content on Tableau Online or Tableau Server will see a dashboard automatically adjusted to fit whichever device is being used.
This feature was designed to give users the same incredible experience that they have on their desktop on their tablets and mobile devices. Tableau device-specific dashboards can be customized to seamlessly display all the information you need, whenever you need it.
Keep reading for best practices and recommendations on creating your own device-specific dashboards in Tableau.
Why Tableau
Tableau is a simple and effective tool for visualizing data. Tableau users can create customized data dashboards without computer coding knowledge. This makes it easy to design a dashboard that allowed for understandable data visualizations and displays the information that you most need.
In this article, we will discuss how to modify this desktop dashboard for different devices. If you are unsure where to start with dashboard design, it may be helpful to participate in Tableau training or hire a dashboard design consultant to create one for you.
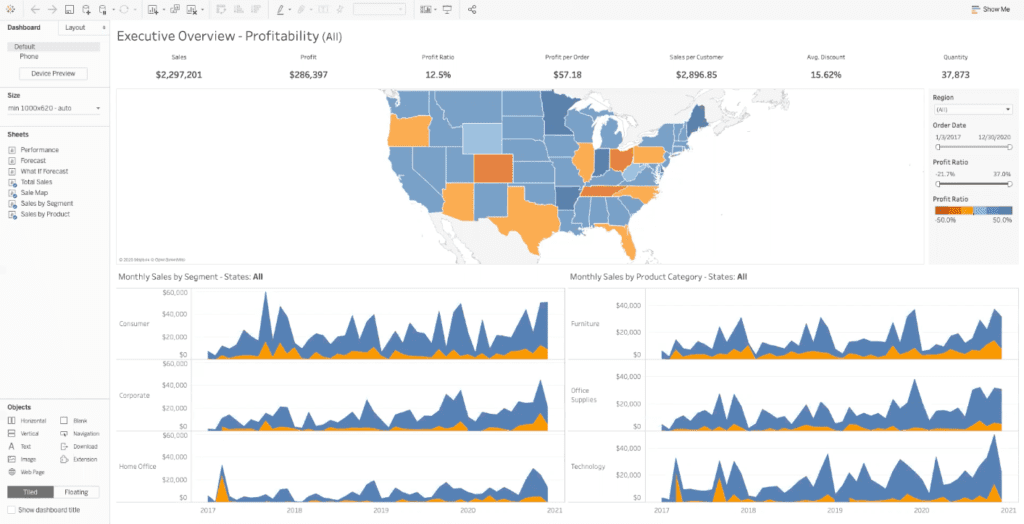
Example Tableau Dashboard
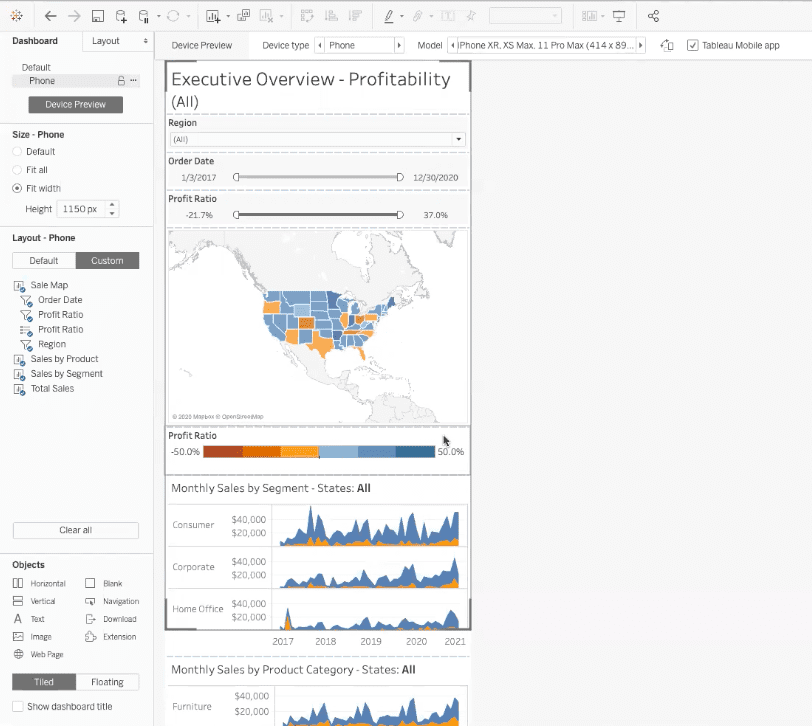
Below is an example dashboard that we have created to showcase the different device-specific views. This dashboard is an executive-level overview of profitability within the United States. It is customized with company colors, a map, and certain data points of interest.
Know Your Audience
Dashboards should be designed with a clear purpose for their intended audience. As you’re designing your visualization within Tableau Desktop, you need to consider who will be looking at it, and the key points they need to understand.
For example, a dashboard designed for an executive-level view of multiple retail stores will differ from a dashboard designed for your in-store sales to view on their tablets and or mobile devices.
Once you know which sections of data you need for your device-specific dashboards, you can begin to create within those parameters.
Our example dashboard below provides a visualization of profitability. This dashboard was designed specifically for executive-level employees, but not all information may be relevant to managers or other employees who are viewing the dashboard exclusively on mobile devices in store. In that case, you may choose to modify the data elements included on different device sizes.
Selecting the Right View
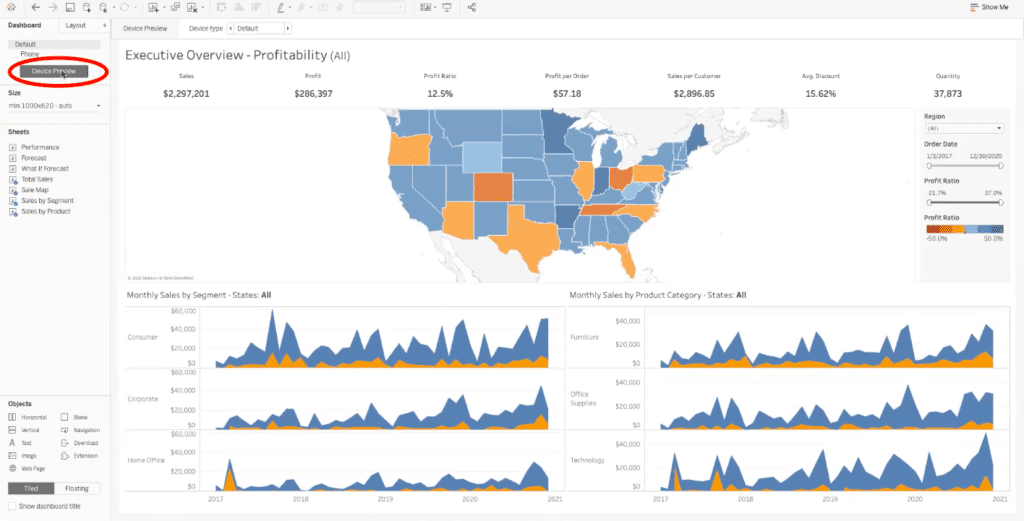
The desktop-specific dashboard in Tableau is often the default view. You can make your desktop window smaller to simulate a tablet or mobile device, and Tableau will do its best to automatically adjust, as shown below.
However, the best way to really understand and design for a tablet or mobile-specific view is to change the selected device.
To select a tablet or mobile view, click “Device Preview” in the menu to the left of your dashboard.
This will add a drop-down menu above your dashboard. In the drop-down menu, you can select desktop, tablet, or mobile sizing. You will also be able to select a specific tablet or mobile device (such as an iPhone X or iPad mini), and whether you want your dashboard in landscape or portrait mode.
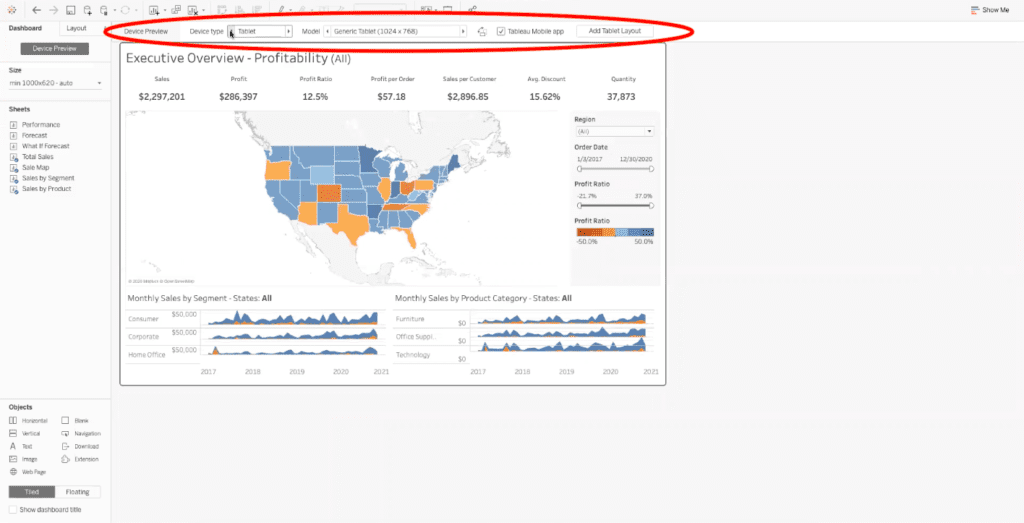
Once you have selected the device and orientation, click the “Add Layout” button on the far right of the device selection bar. Tableau will adjust your dashboard to fit into the correct size. Now you can begin to customize your dashboard.
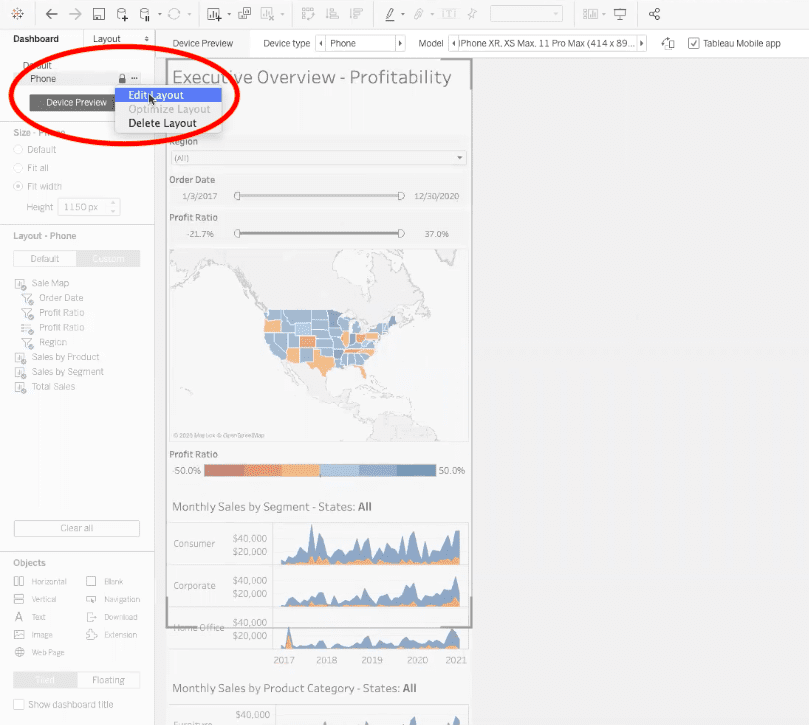
To begin editing our mobile-specific dashboard, click the three dots above our device preview button, and then click “Edit Layout” as shown below.
Best Practices for Customizing Your Device-Specific Tableau Dashboard
1. Keep Filters at the Top
We recommend placing filters at the top, as shown in the photo below. Filters are typically what end users want to see first so they can begin interacting and customizing their unique view within the dashboard.
2. Remove Legends
With screen space this small, it’s a good idea to get rid of any legends, removing them completely from your mobile dashboard unless they are absolutely necessary for understanding the data.
In our example dashboard, we have a legend below our map, but we can also see that information represented when hovering over individual states, as shown below.
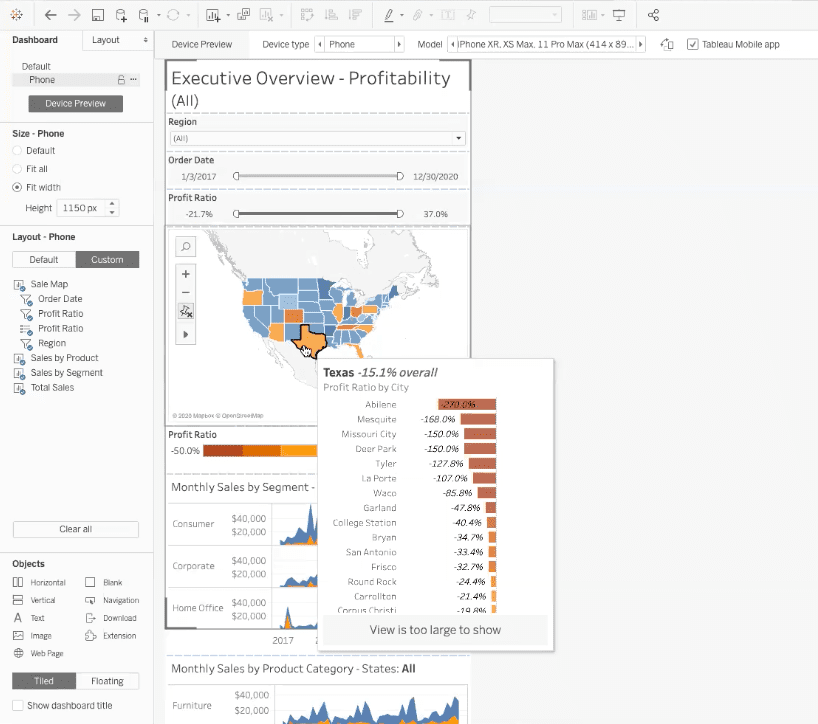
Because the information on the map is visible on hover or tap, it is safe to remove the legend to make this Tableau dashboard more mobile friendly.
Note, if you delete a section of the dashboard in a device-specific view, it will not remove it from the default dashboard view.
3. Make Sure End-Users Know to Scroll
As you can see, there is less space for data to be shown side-by-side in the mobile view. It may seem like scrolling will prevent users from looking at the dashboard, but, in reality, vertical scrolling is perfectly fine. Horizontal scrolling, on the other hand, you’ll want to avoid.
In the mobile-specific view, you can resize your data to fit perfectly within the screen size. However, this may prevent end-users from seeing all of the data. We recommend sizing your dashboard so that some of the data is out of the initial view, or resizing it to fit some of the data below into the initial view, like in the photos below.
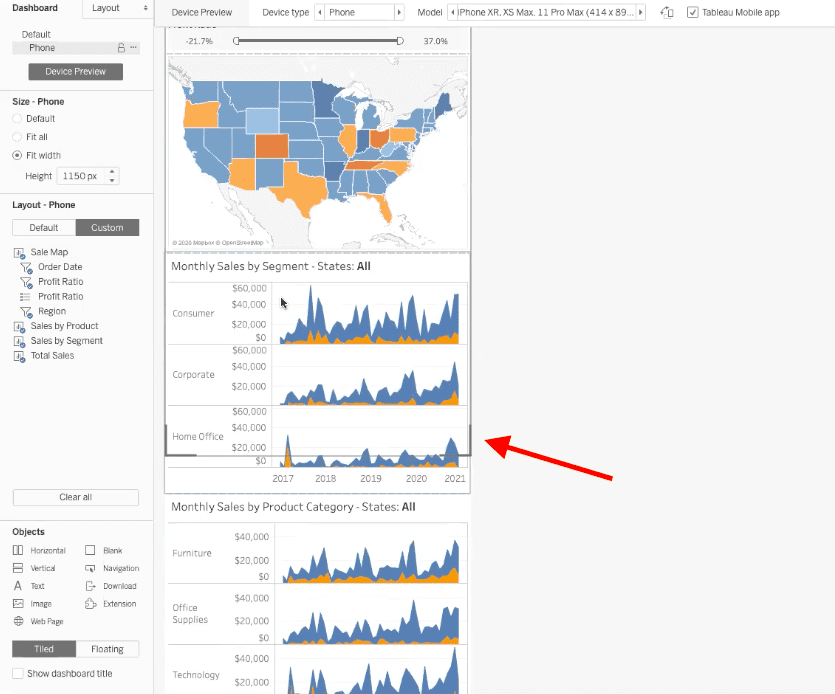
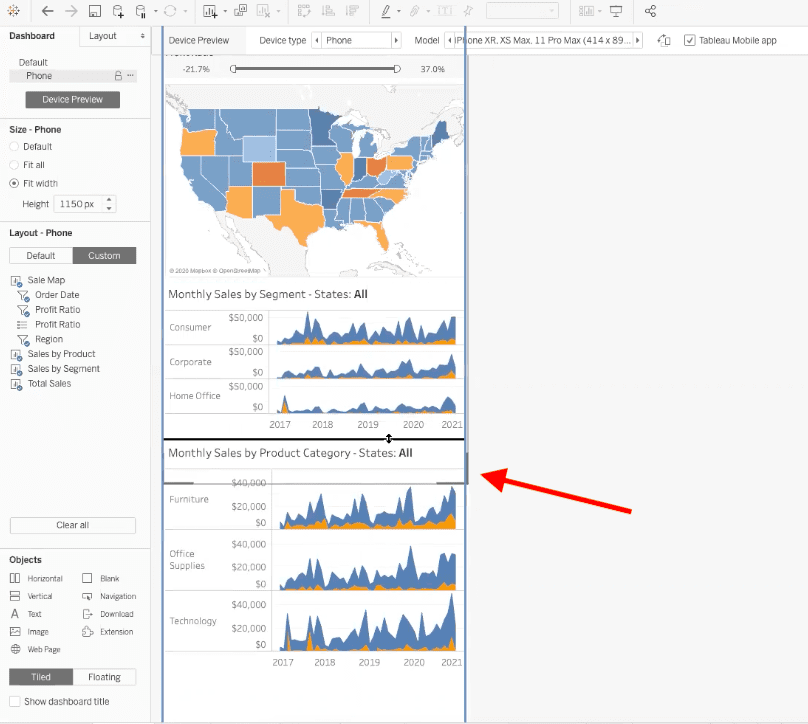
In both cases shown above, part of the data is visible “above the fold” of the device, so an end-user knows to scroll to see all of the available data.
Making Your Mobile Tableau Dashboards Work for You
Tableau can be used to create stunning, easy to understand data visualizations that can be used on any device. When you take the time to create custom layouts for Tableau Server or Tableau Online for mobile phones and tablets, your dashboard’s users will have the benefit of a customized view, though you only have to create a single dashboard at a single URL.
After setting up your mobile dashboard, you’ll want to test it by viewing it in different size browser windows and on all applicable devices. Providing a platform for your users to give you feedback on the dashboard will help you to ensure you’re providing the best information on each specific device.