
Data insights are most valuable when they reach the people who need them, where they’re already working. Instead of asking your team to open another dashboard or switch between applications, you can bring Tableau analytics directly into Slack conversations and use AI to make exploring your data even easier.
Tableau offers several ways to integrate analytics into everyday workflows, including Tableau Cloud Subscriptions and Alerts, Pulse Metrics, Tableau Next and Metrics Share deliveries, and integration of AI-powered tools like Claude and Slackbot.
In this short tutorial, I demonstrate how to share Tableau Next dashboards and Metrics to Slack, use Claude to generate and distribute insights, and ask natural-language questions about your data without leaving Slack.
You’ll learn how to:
- Share a Tableau Next dashboard directly to a Slack channel.
- Send Tableau Next Metrics to Slack with additional context.
- Use Claude to retrieve analytics insights and generate summaries from Tableau Cloud.
- Ask Slackbot questions about your data and receive charts and explanations.
- Follow links from Slack back to Tableau Next for deeper analysis.
Watch the Video
Read the Transcript
[00:00:00] Celia Fryar: Hi, I’m Celia Fryer. Let’s talk about bringing insights into the flow of work. Taking those insights to where people already have those apps open: the inbox, the Slack channel, the Teams conversation.
Tableau platform has given us a variety of options. Some of the newer ones is Pulse Metrics, Slack, MCP, and Agents. We can have Claude orchestrate getting the brief and posting the summary to Slack.
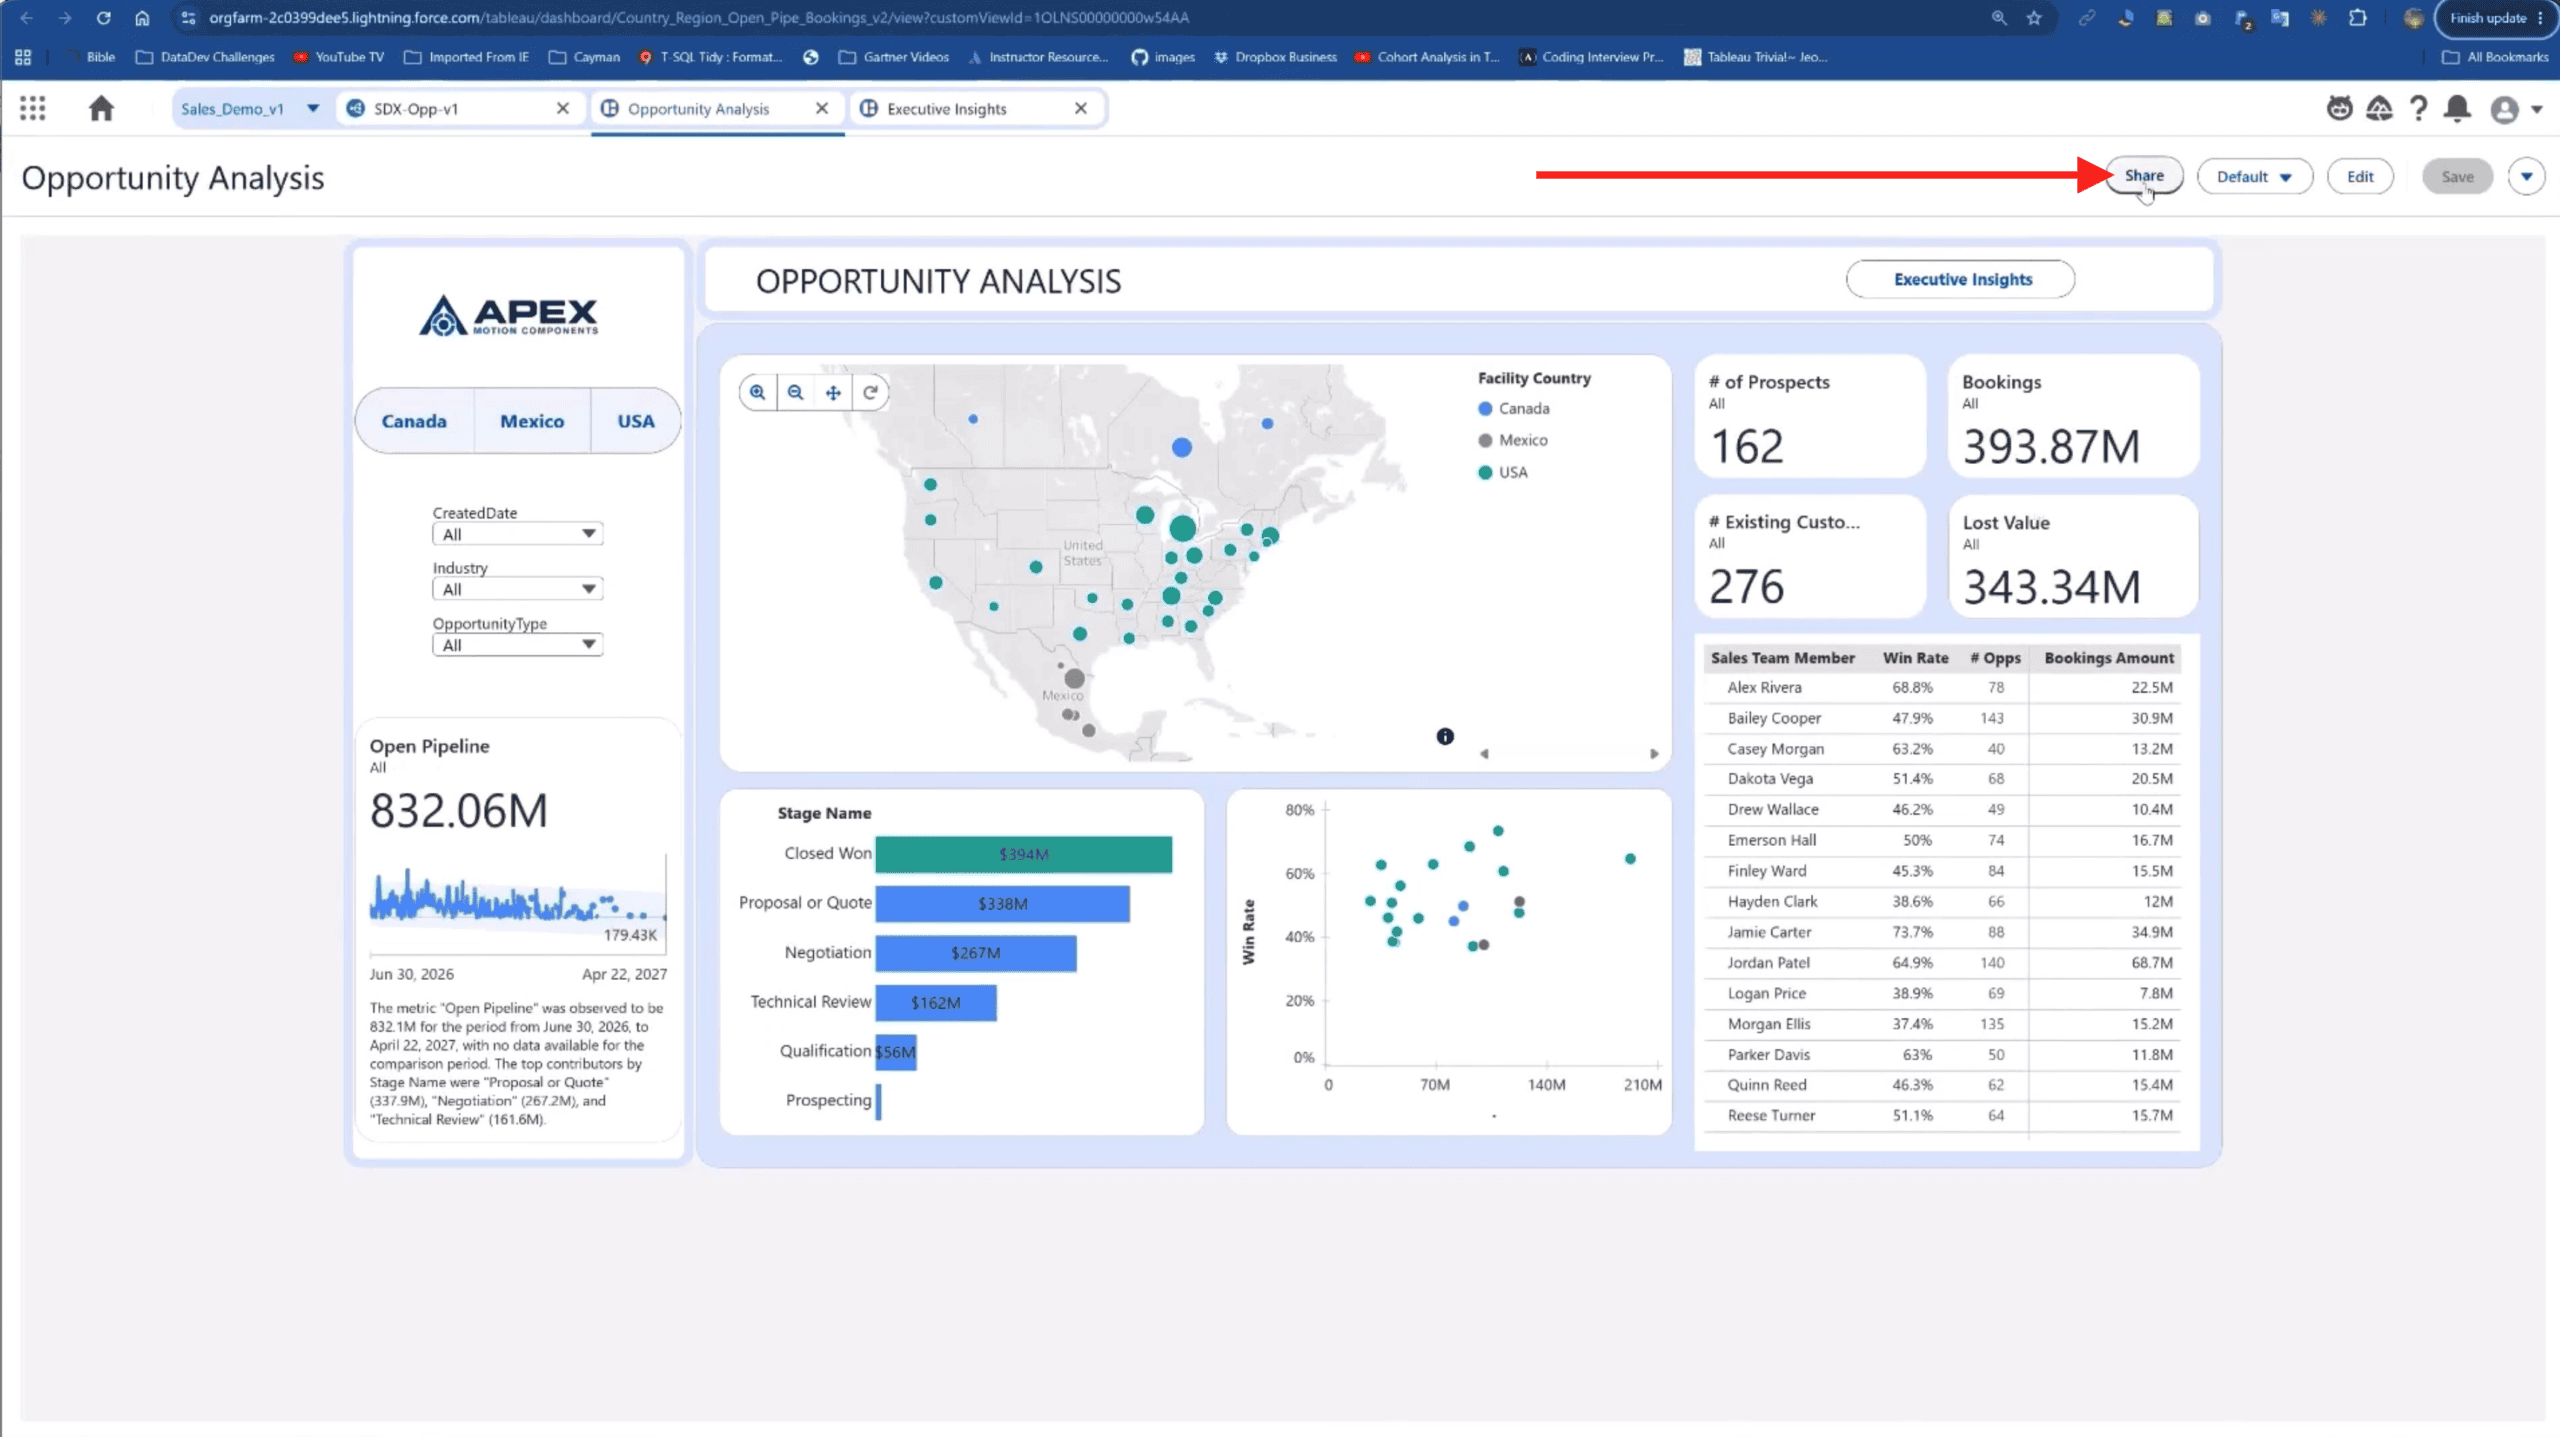
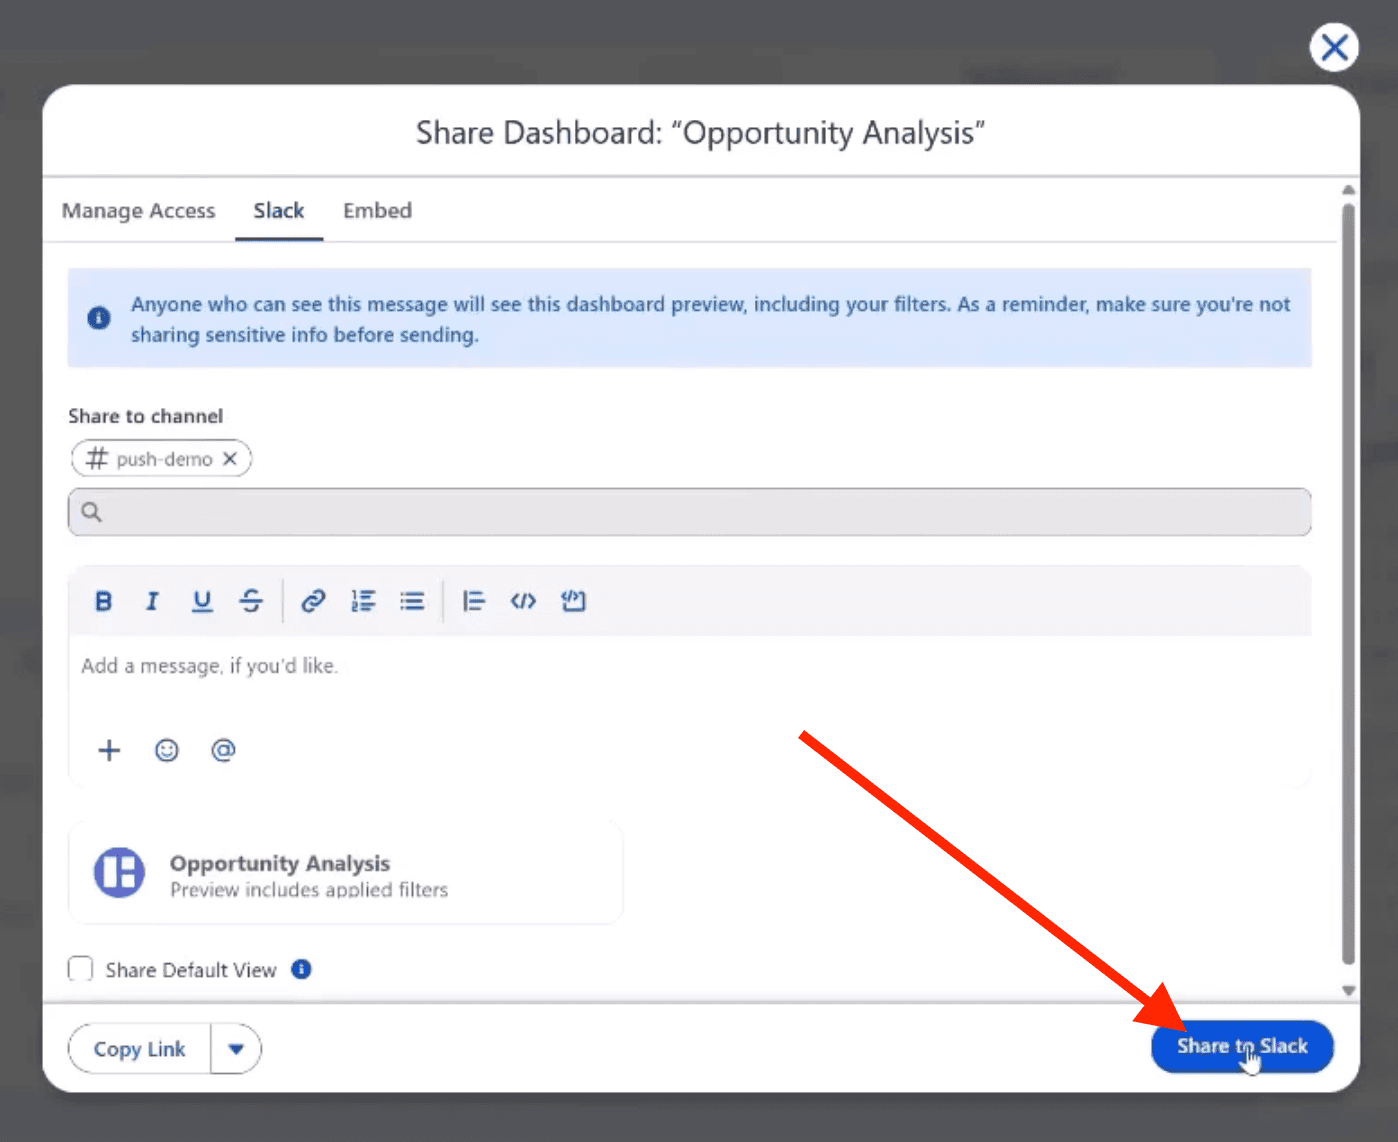
We also can send things from Tableau Next. So the dashboards, the metrics. To send a dashboard, the top right-hand side of all the dashboards gives us a share button. Make sure that your people have access, and then choose Slack. Pick a channel.
And then you have an opportunity to send a message as well, should you like to do that. Click Share to Slack, and within seconds it’s gonna be showing up in that Slack channel. It’s also gonna appear with a blue hyperlink so that you or others who receive it can come back to Tableau Next to see that dashboard and interact with it more fully.
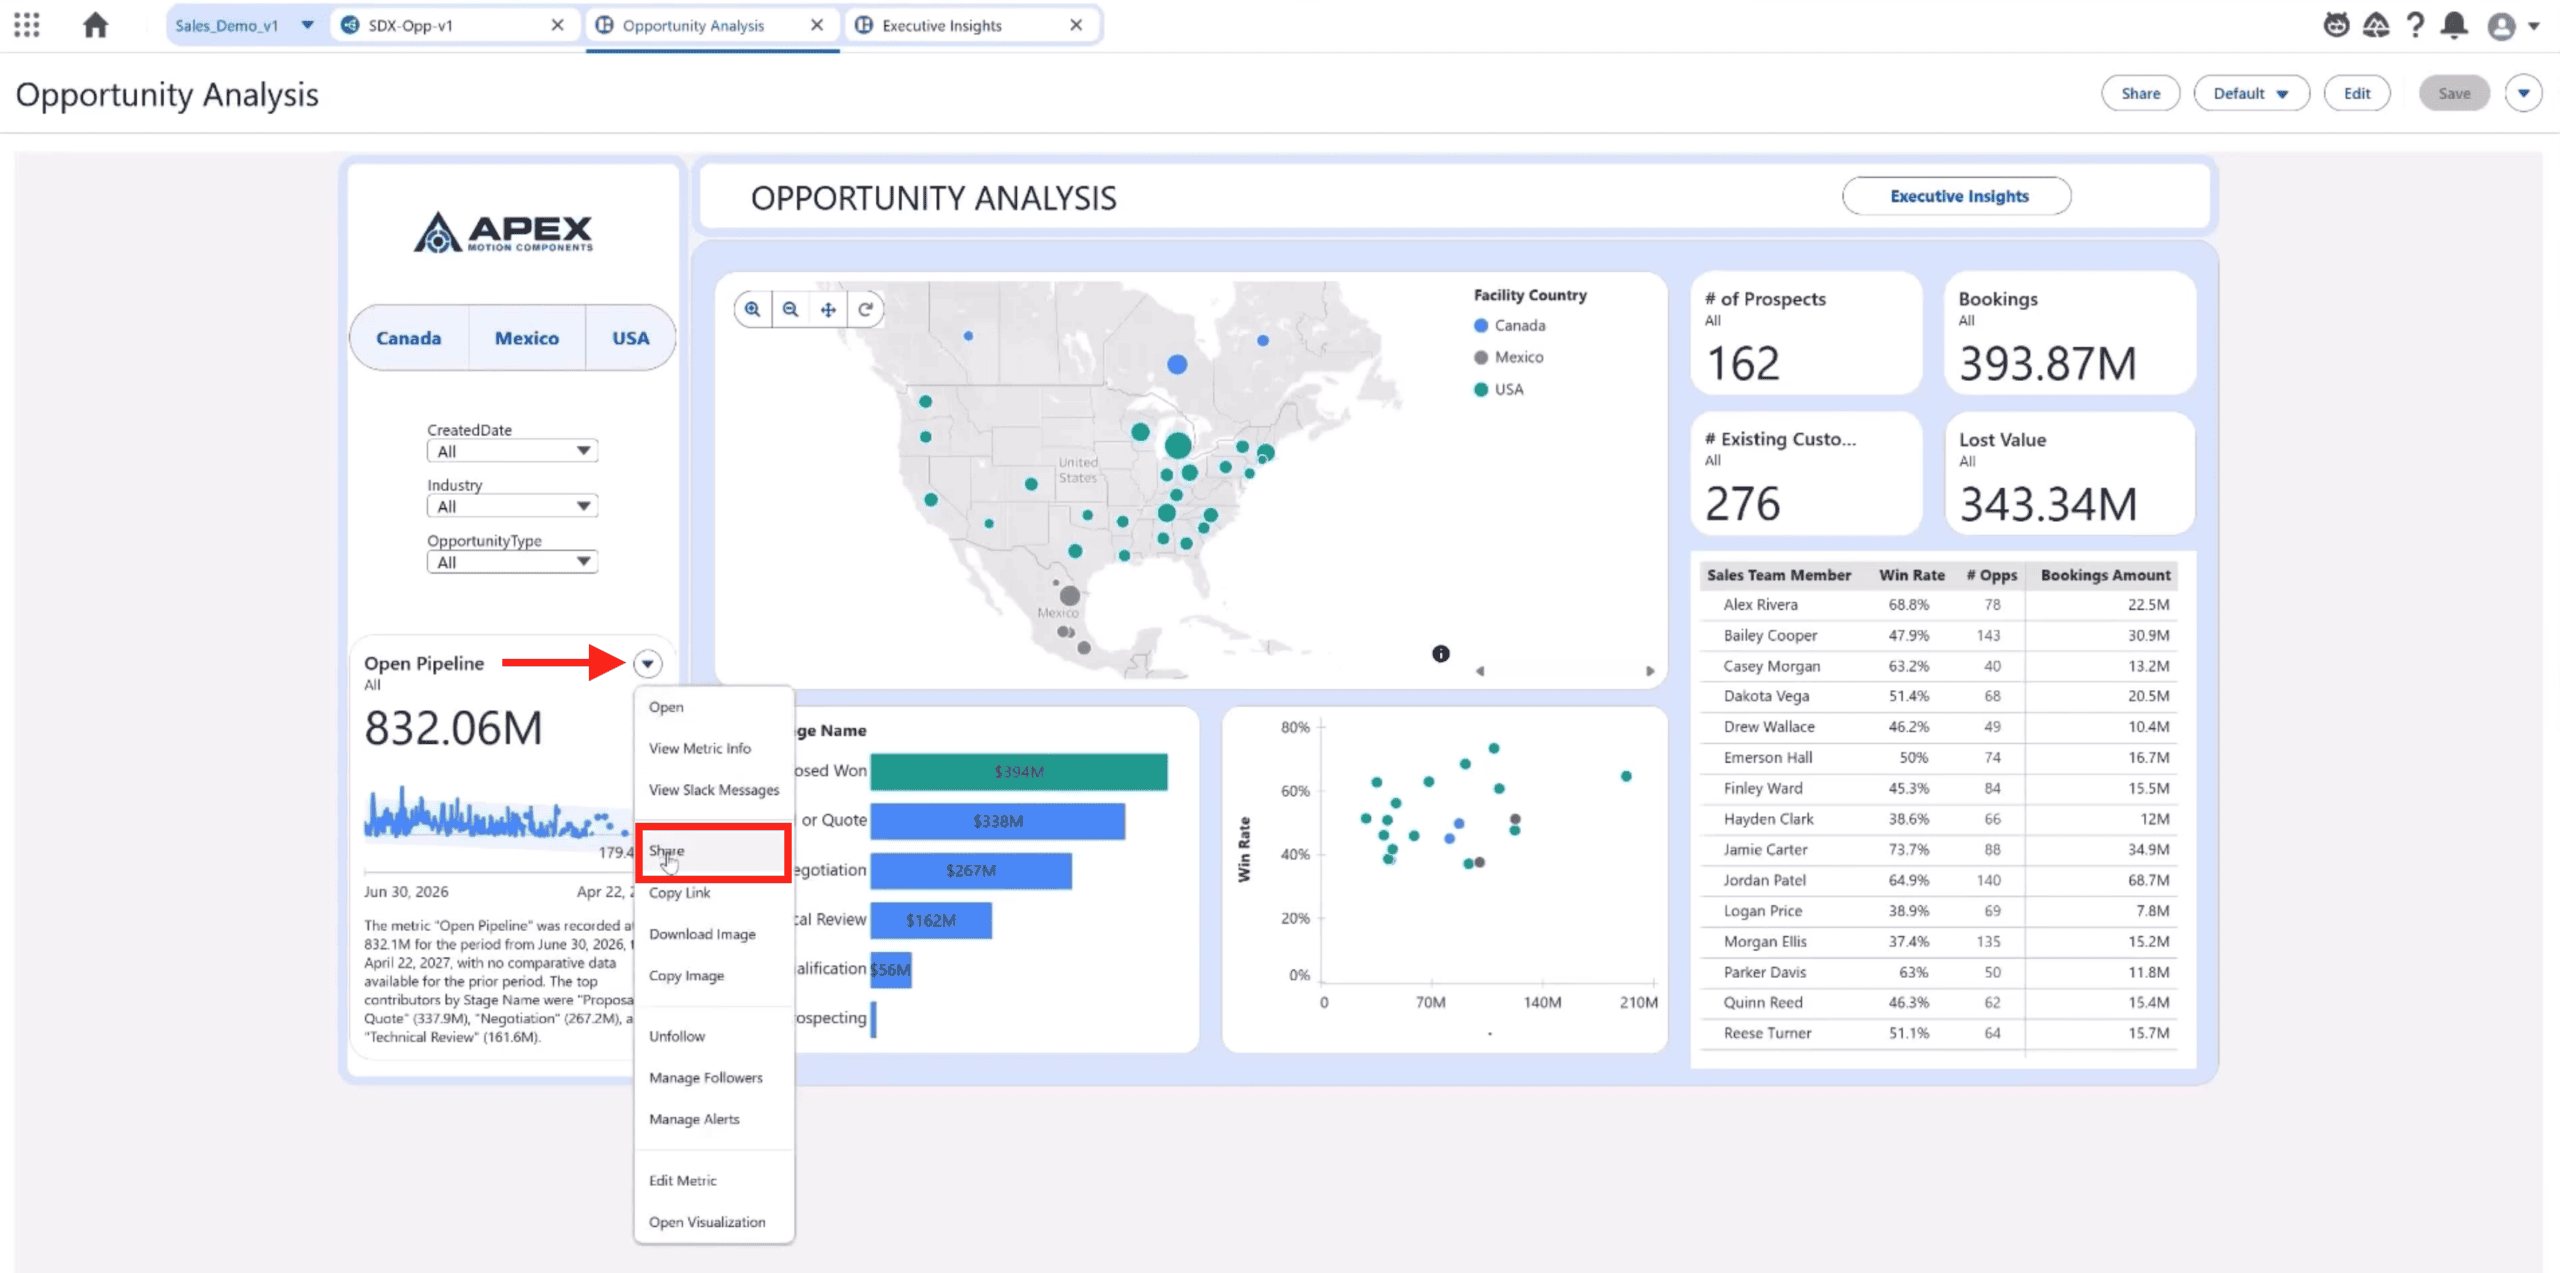
So let’s take a look at that metric. What if I wanted to send it to Slack? On the top right-hand corner of every metric in Tableau Next is a drop-down caret that opens up a menu. Share is on that menu. So select Share, select the channel that you want to send it to.
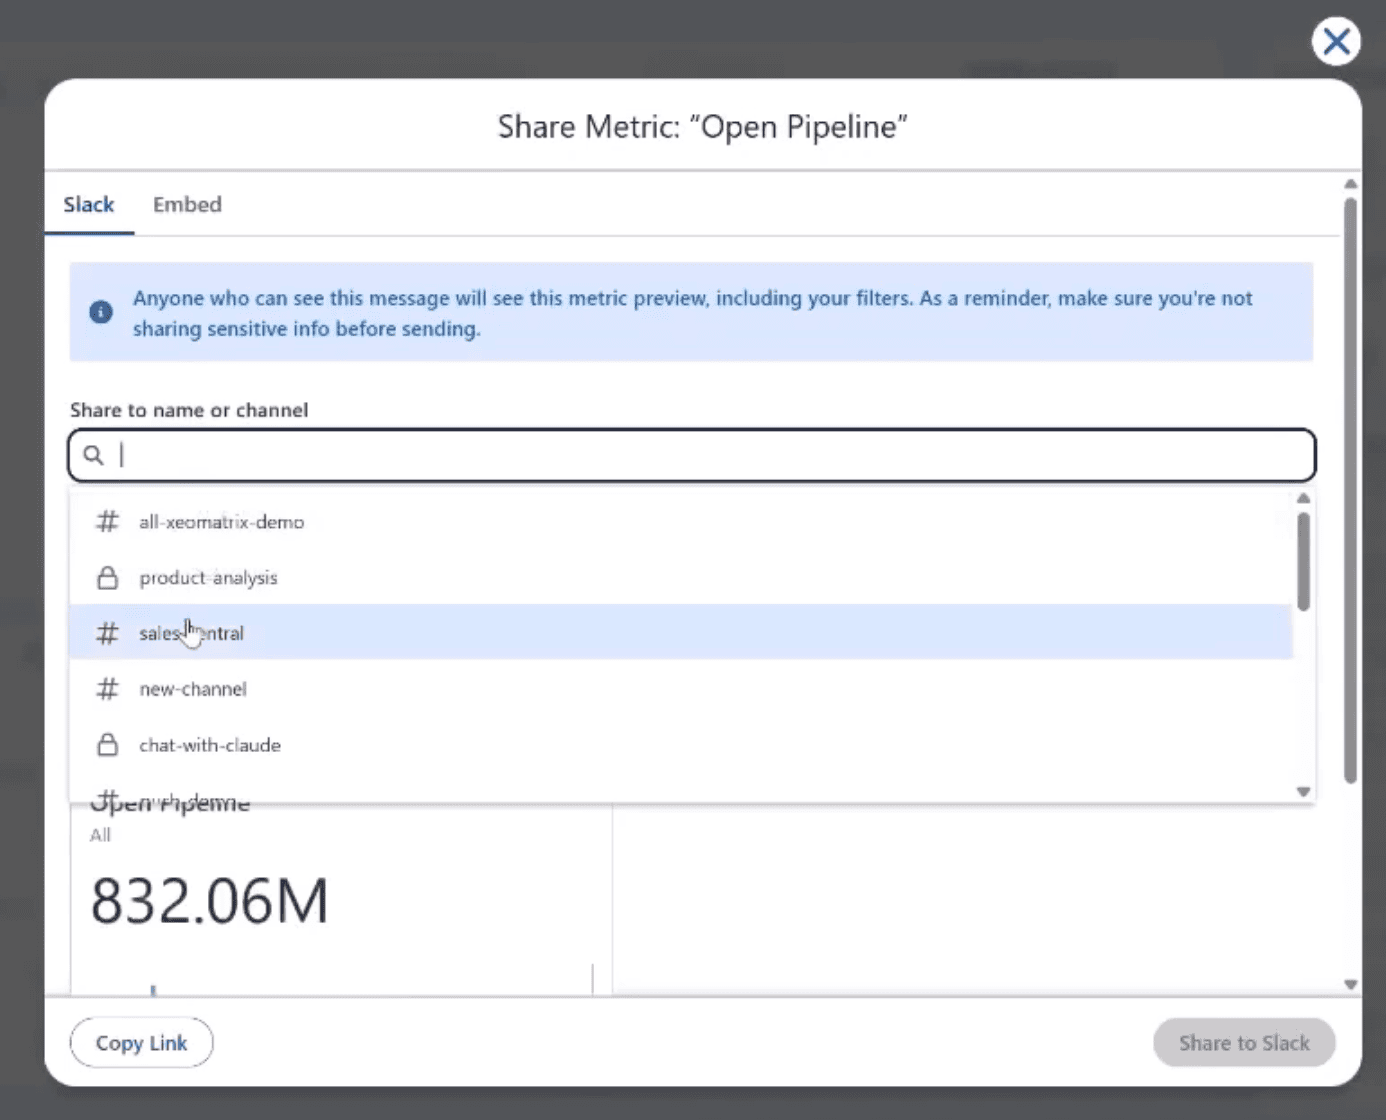
And then we have the opportunity again to leave a message. We get to see a preview. Click Share to Slack, and within seconds it appears in our Slack channel. There you have it. Also with the return loop, should you choose to do that. What if I wanted to let Claude orchestrate this conversation? I’ll share with you the prompt I gave it, and you’ll see the great results that I got from it.
This is just an example of what it’s capable of.
We also can have Slackbot do our work. Okay. And that just showed what the connections were back over to Tableau Next. So I’m asking a question there about showing me my total bookings by product family in the opportunities tables. Does a little thinking, and then it gives me a chart. So I’ve got the summaries there by the product family.
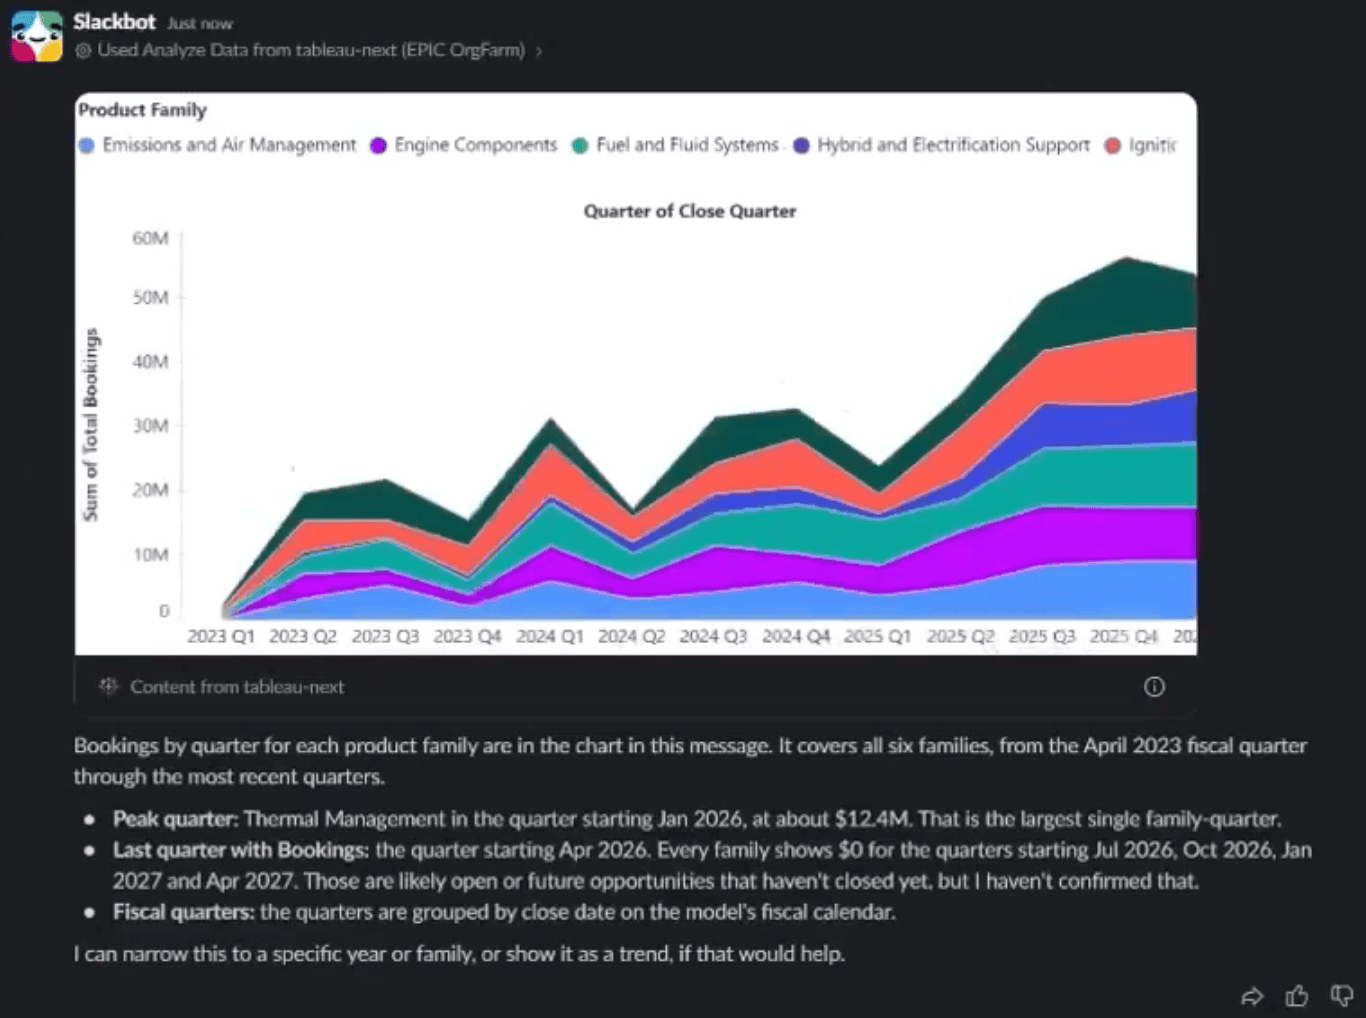
I also have a description below giving me a narrative about that as well. I’m gonna ask another question, asking for a breakdown by quarter for each of those product families. Does a little thinking and planning And then it gives me a chart to show that with some pretty lively colors over time and a narrative giving me more details.
Why Bring Analytics Where People Work
You built a great dashboard. A few saw it. Fewer used it.
Pull analytics asks busy people to remember a URL, log in, find the view, and know what to look for. That works well for deep analysis. It’s a slow way to keep a team on top of the handful of numbers they watch every day.
Push analytics flips the burden: the insight travels to where people already work. In Slack, your team can share a dashboard or Metric in the conversation where the decision is happening, ask a question in plain English, and follow a link back to Tableau Next when they need to dig deeper.
Let’s look at four ways to make this happen.
Four Ways to Share Tableau Data in Slack
How to Share a Tableau Next Dashboard in Slack
Share a dashboard when you want colleagues to see the whole picture and explore it themselves.
Step-by-step instructions
- Select a Tableau Next resource. Navigate to the dashboard you want to share.
- Locate the Share button. In the upper-right corner of the dashboard, click Share. The Share Dashboard dialog will open.
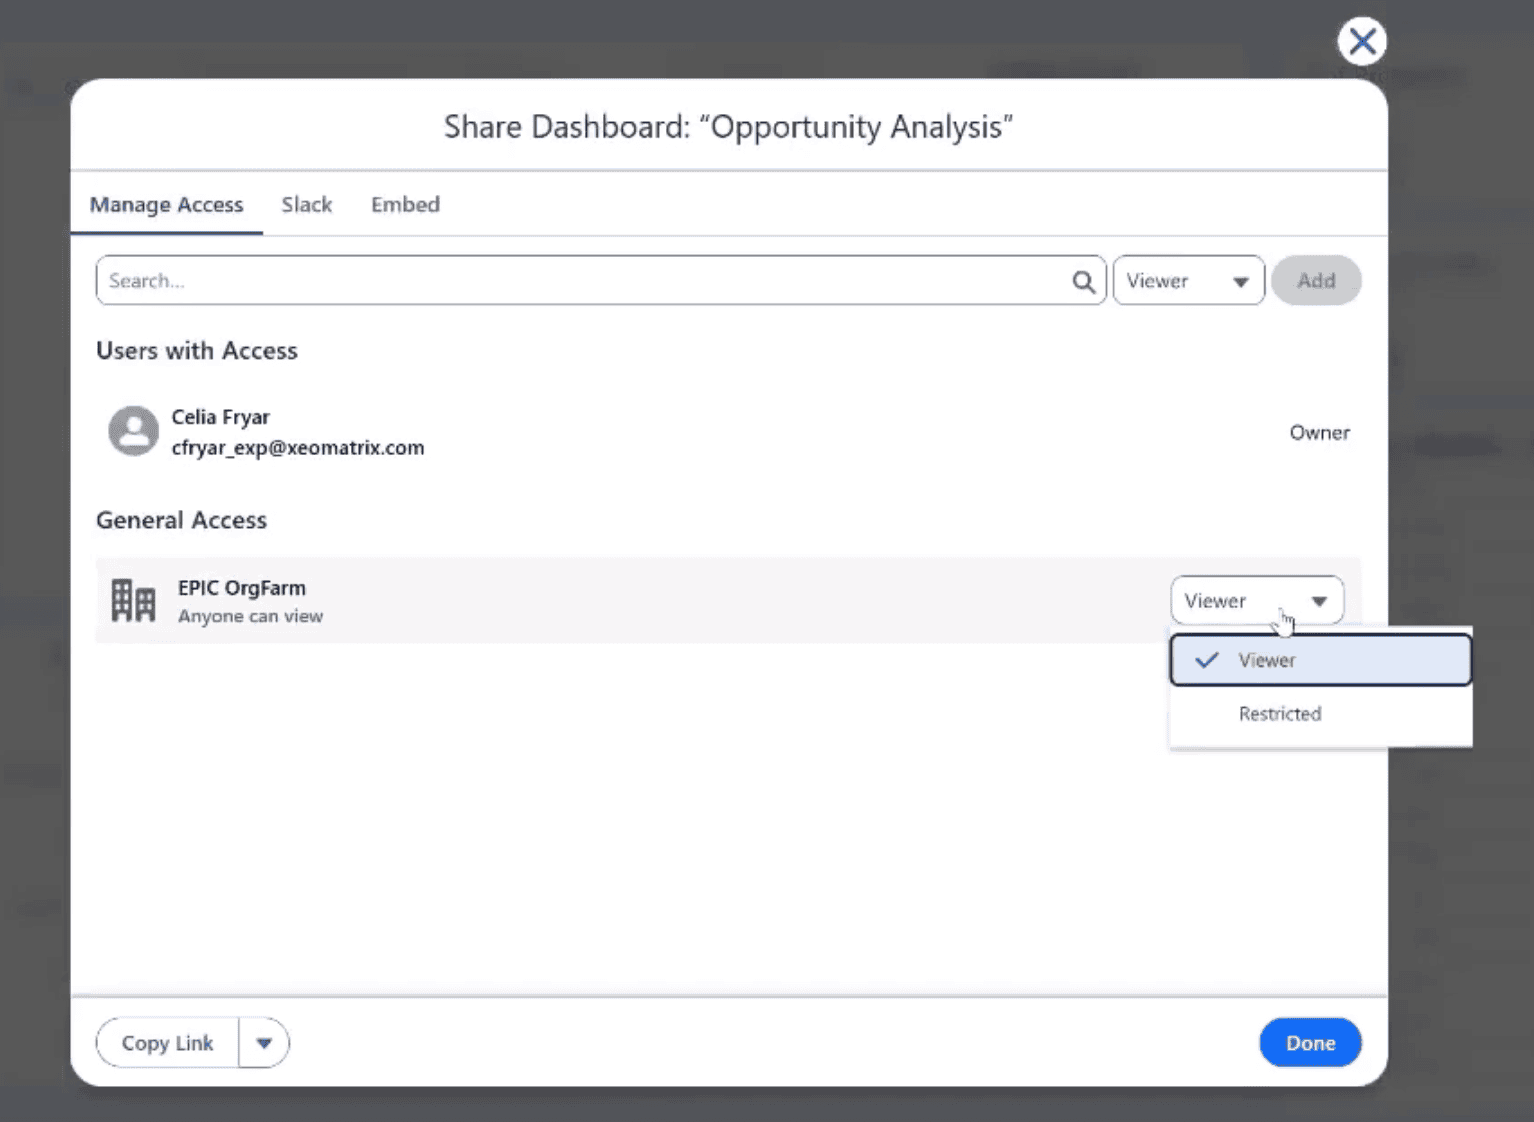
- Check access permissions. On the Manage Access tab in the sharing modal, make sure the intended recipients can access the dashboard. Permissions will always be respected.

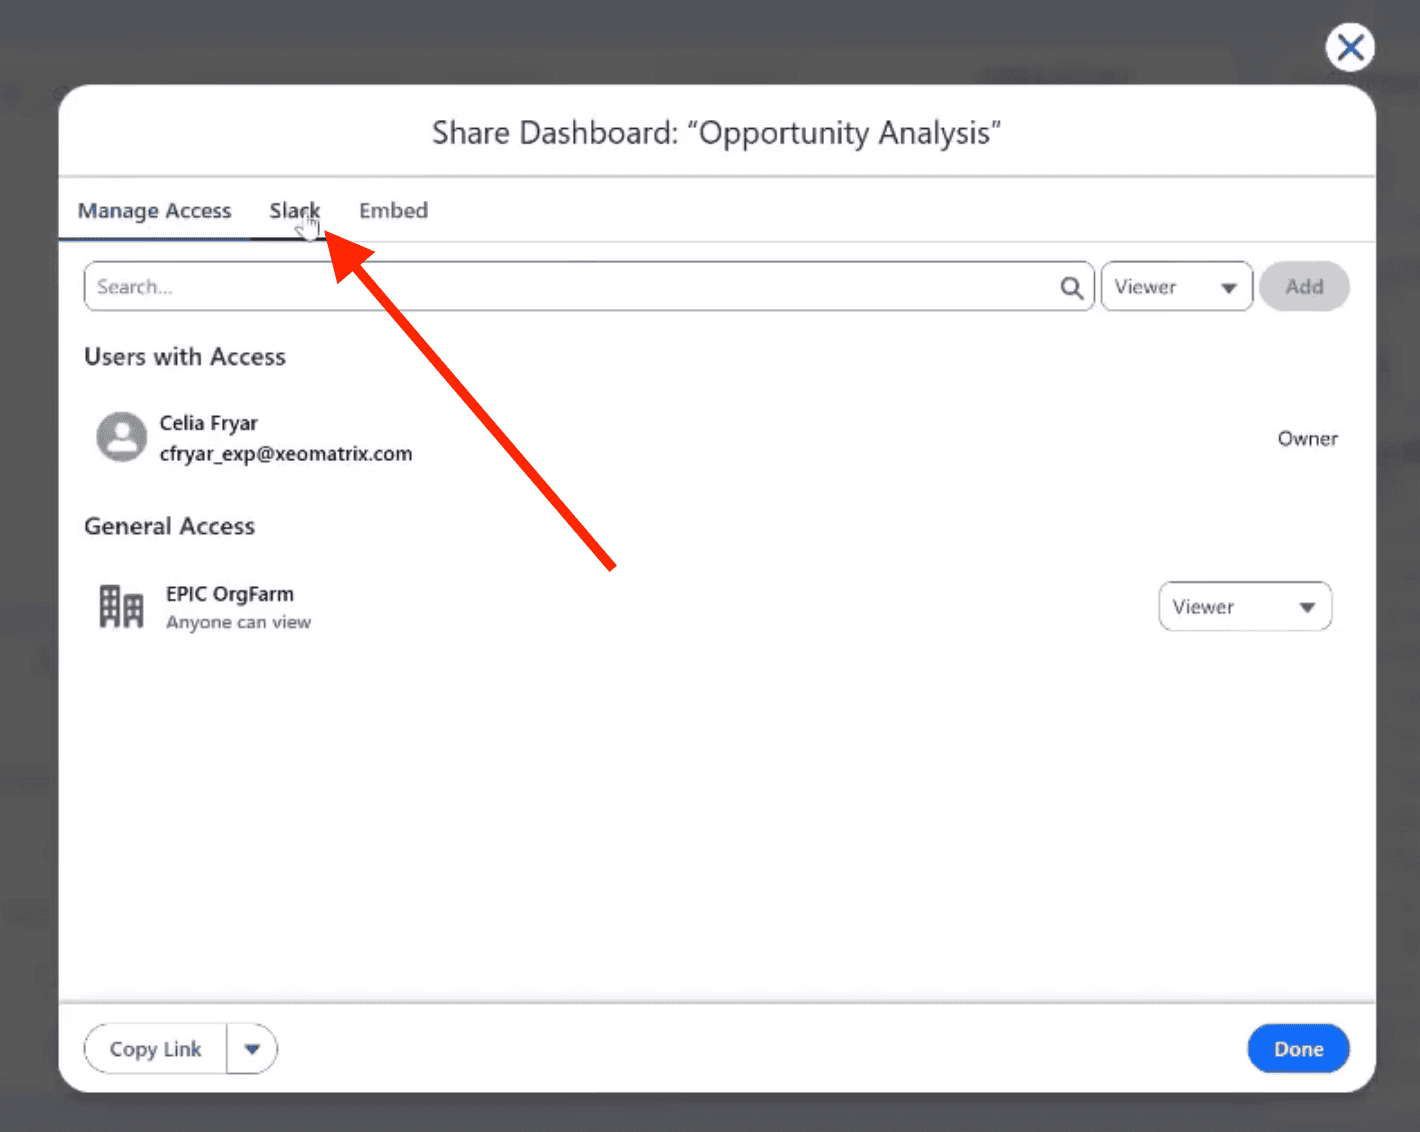
- Select the Slack tab.

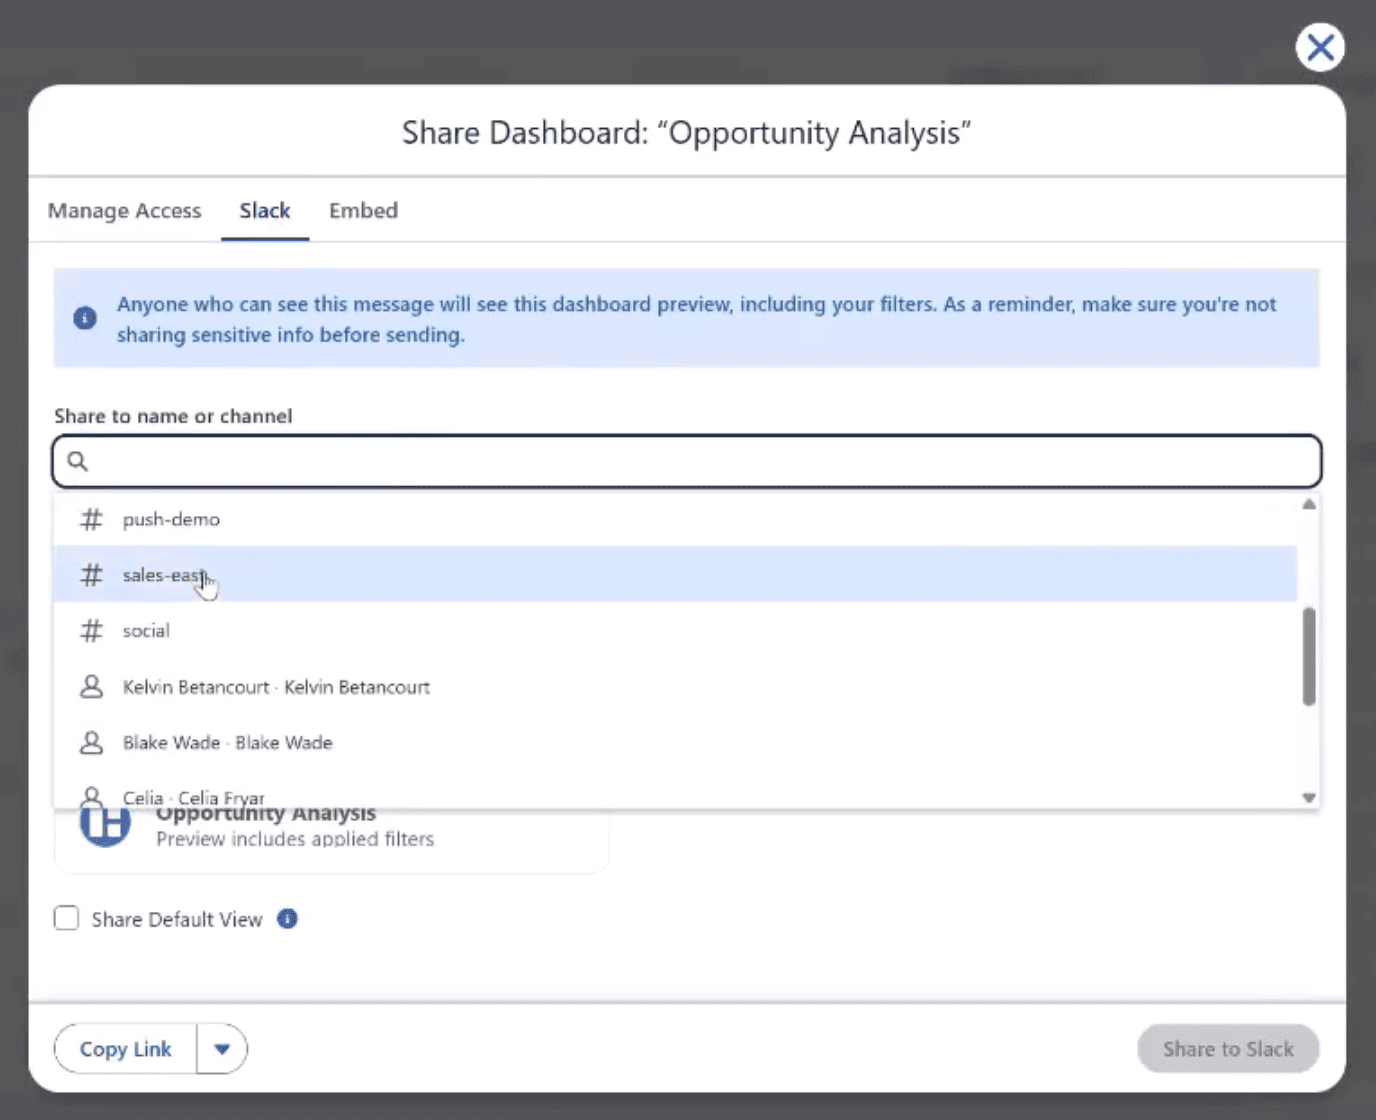
- Choose your destination. Select the Slack channel or person where you want the dashboard to
be shown.
- Add a message (optional). Include context or highlights about the dashboard.
- Click the Share to Slack button. Tableau Next sends the dashboard to your selected destination.

- Review the message in Slack. Open the channel to confirm delivery.

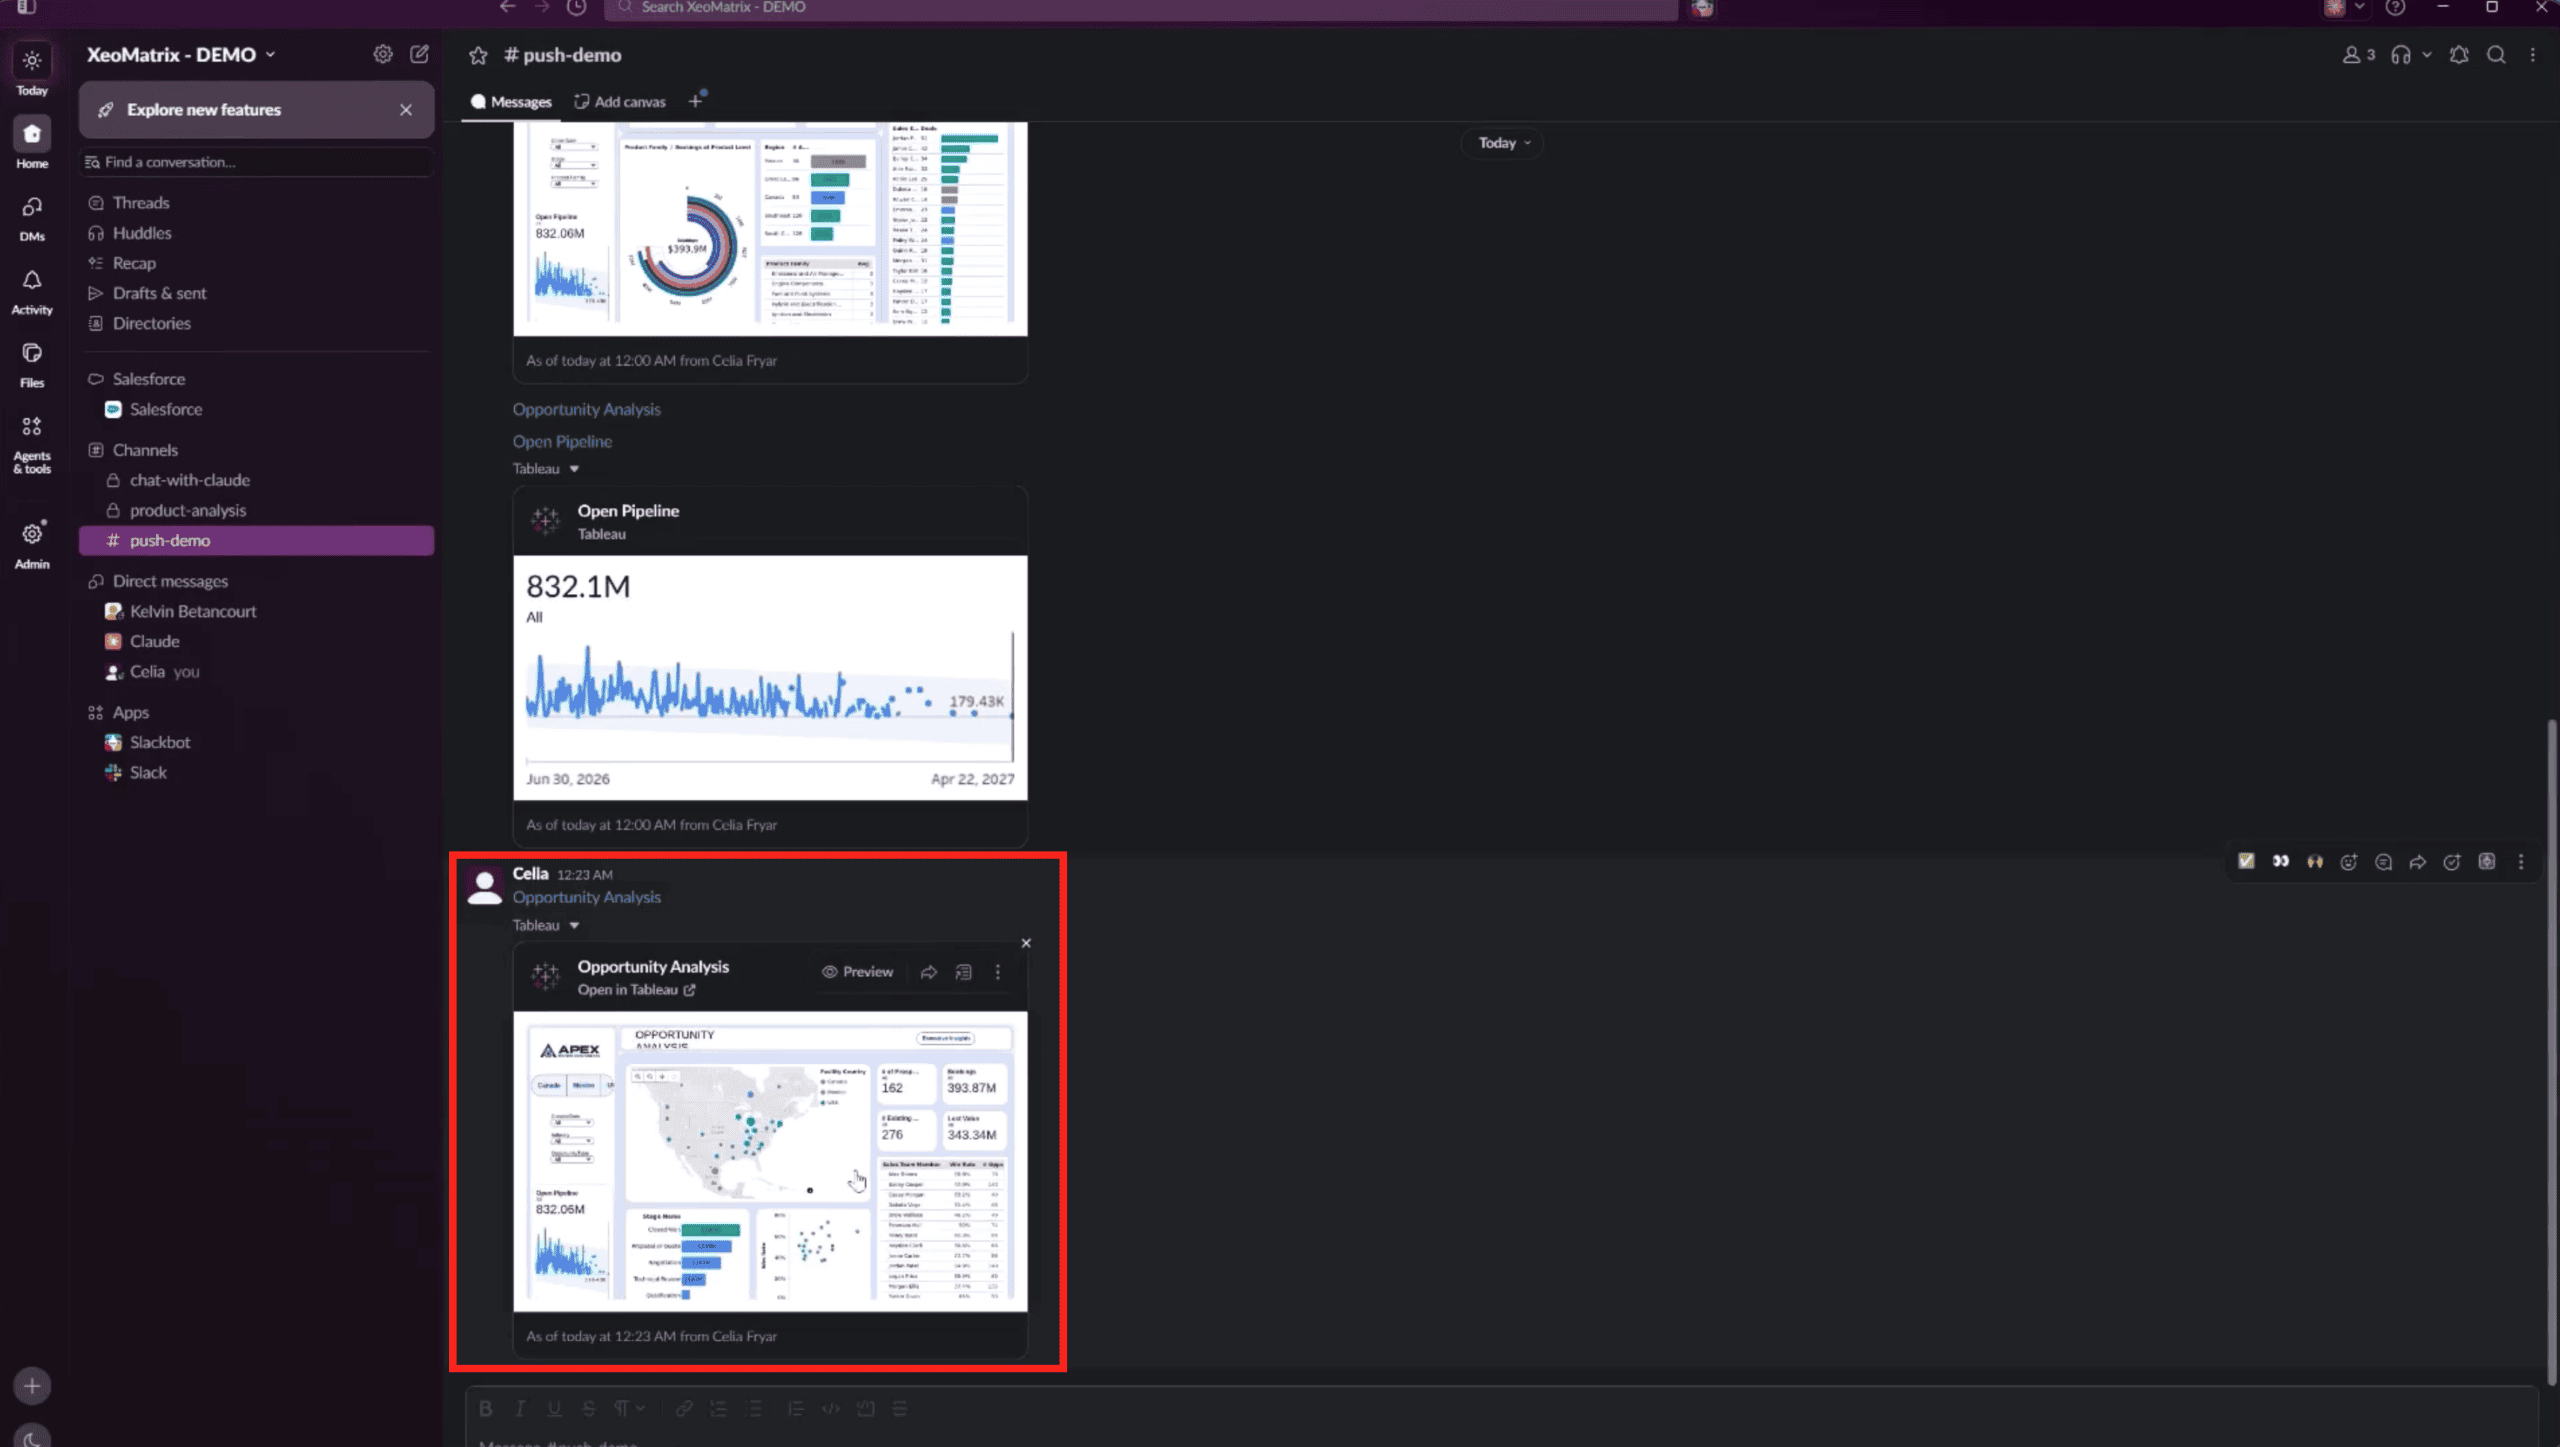
The post links back to the source location. Anyone who selects it sees only the data their permissions allow.
How to Share a Tableau Next Metric in Slack
Share a Metric when one number needs the team’s attention, such as a Total Bookings Metric sent to the team responsible for it. A single result keeps the conversation focused, and the full dashboard is one click away.
Step-by-step instructions
- Open Tableau Next. Navigate to the metric you want to share.
- Open the metric menu. Find the dropdown caret in the upper-right corner of the metric.

- Select Share. The Share Metric dialog will open.
- Choose a Slack channel. Select the channel or a person for delivery.

- Add a message (optional). An option to add a message. Tell the team what to look for.
- See the preview. Tableau Next provides a preview of the content that will be shared.

- Click Share to Slack. Send the metric to your selected channel.

- Confirm delivery. Open Slack to see the shared metric.

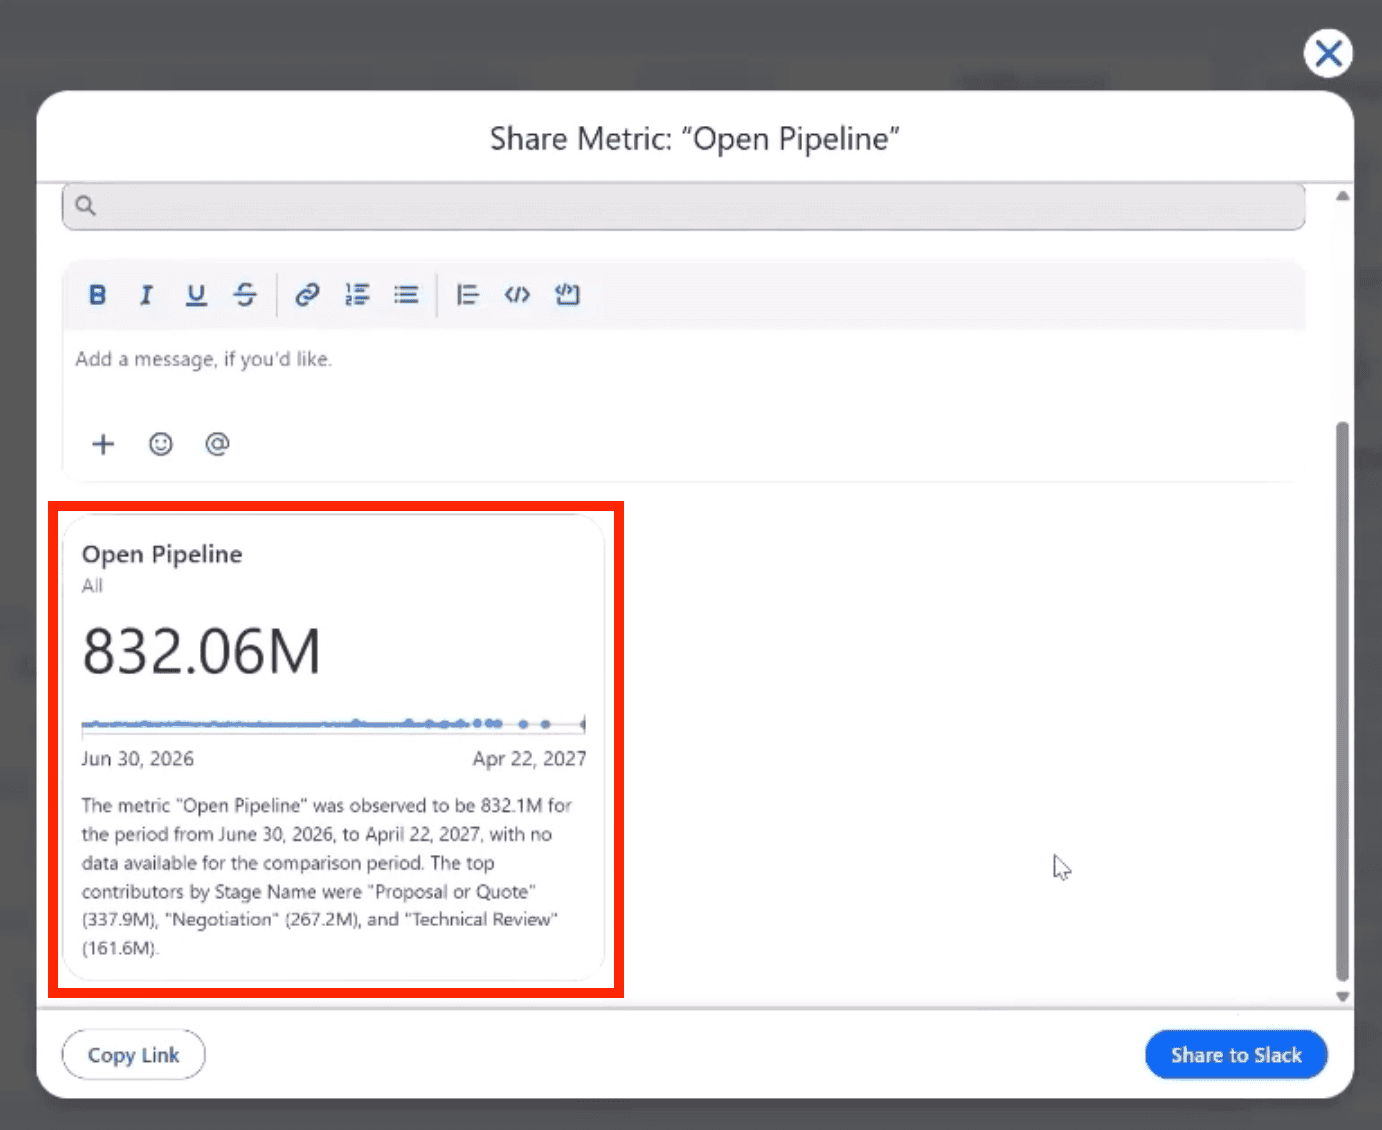
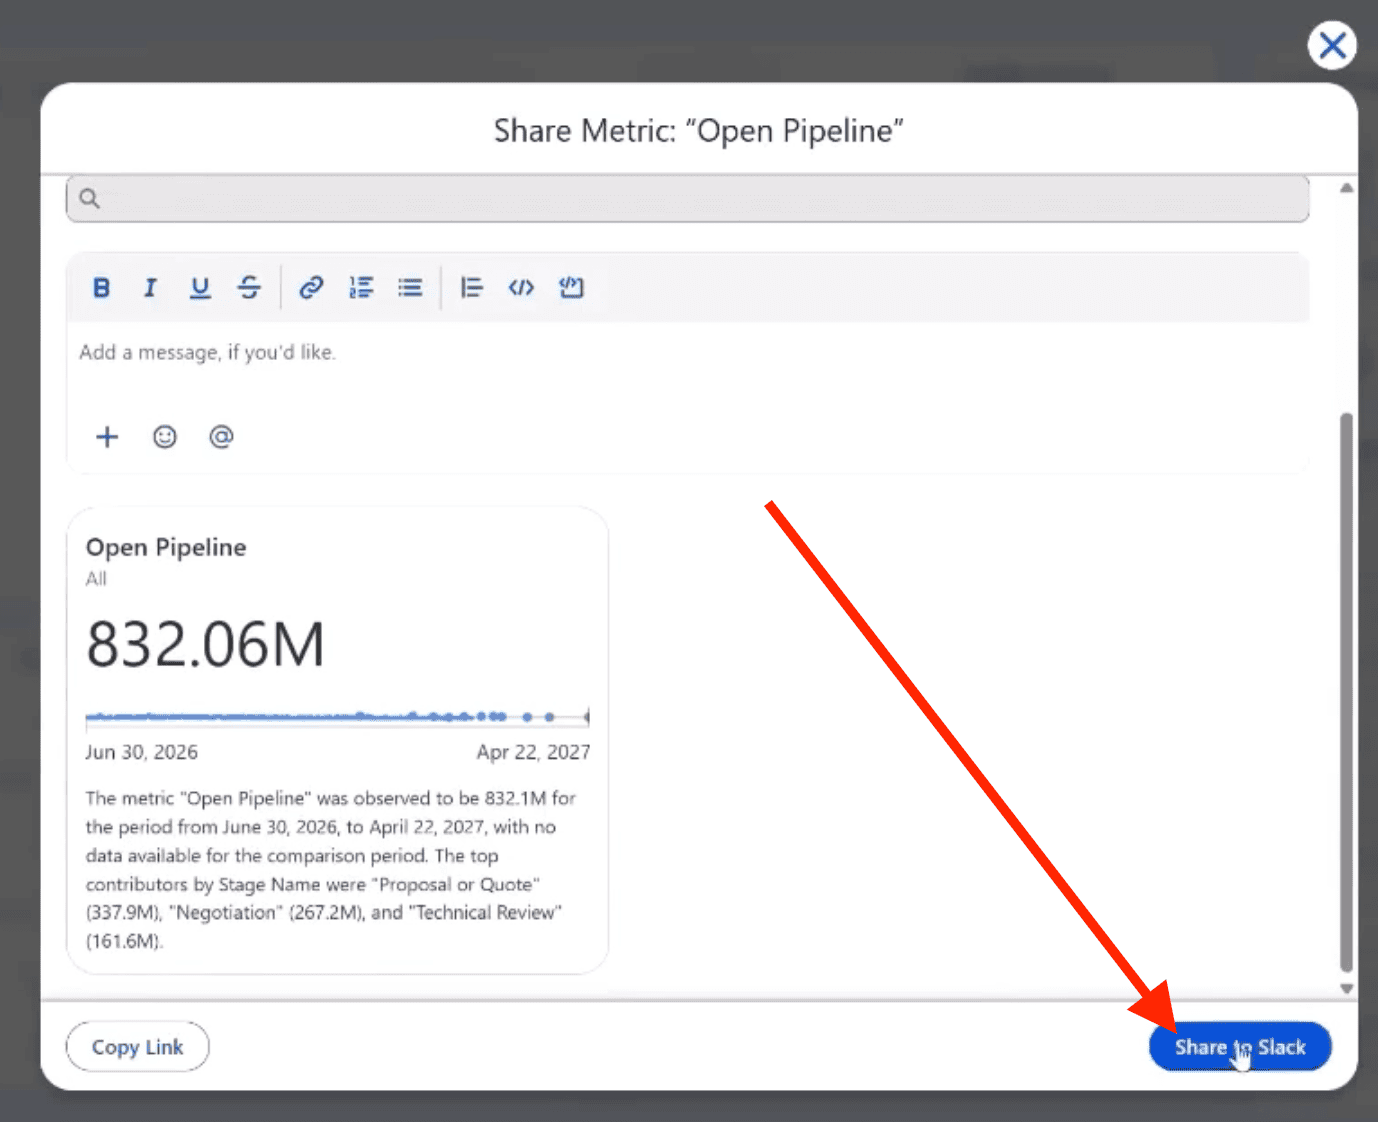
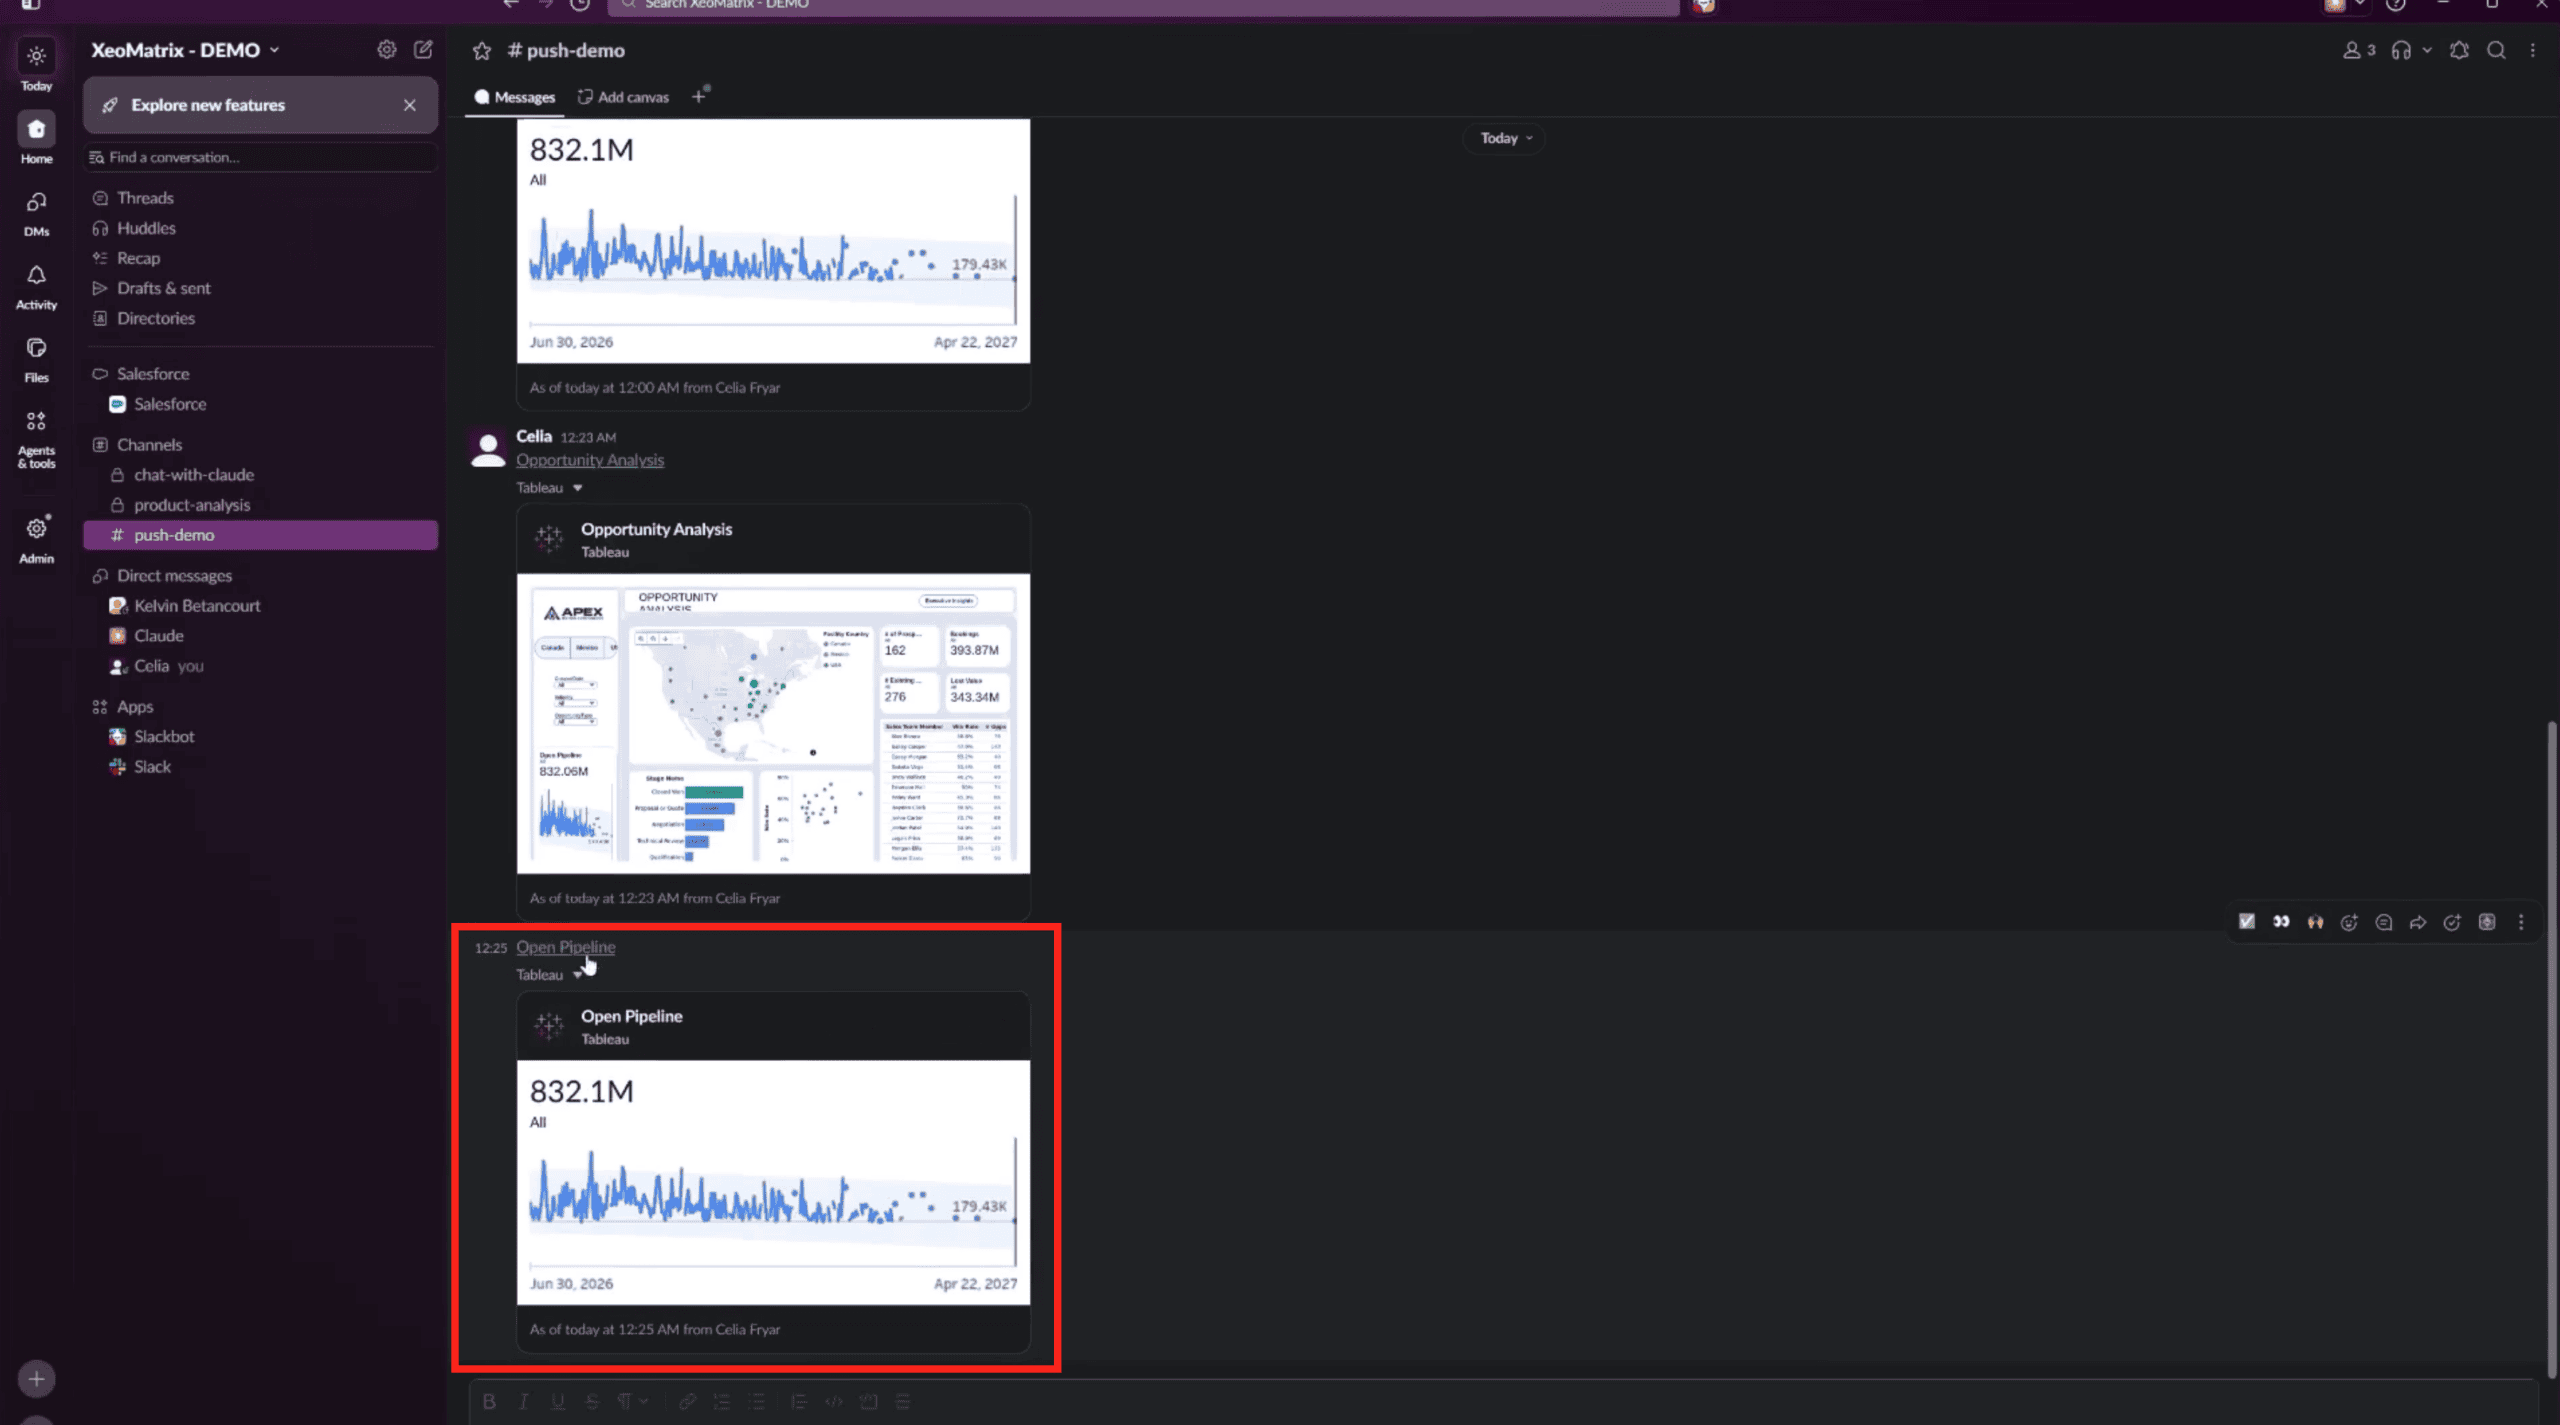
Shared metrics also include a link back to the metric’s deeper dive site, providing the opportunity to quickly
enter the broader analytics environment for additional exploration.
Tip: If Share to Slack is grayed out, follow the Metric first, then try again.
How to Use Claude to Generate and Share Tableau Insights
Sharing by hand works when you already know what to share. An AI agent can do the legwork: find the number, check it, write the summary, and post it. In the video, one prompt to Claude pulls a Pulse Metric from Tableau Cloud, breaks the change down by category, confirms the categories add up to the Pulse total, and posts a summary table to Slack.
Claude does this through MCP, the Model Context Protocol, a standard way for an AI assistant to use other systems. Tableau publishes an official MCP server, and Slack has one too.
MCP doesn’t hand the AI your data. It asks Tableau questions as you.
When you connect with your own Tableau sign-in, every request runs under your permissions. Claude receives only the results of the questions it asks, only from content you’re allowed to see, and those answers come from the same data sources and Pulse Metrics your team already governs. Your security model stays in charge.
Before you begin
Connect Claude to Tableau and to Slack. Tableau’s MCP integration guide covers the Tableau side, and Claude’s Slack connector lets Claude post to the channels you choose. Your organization may require administrator approval for either connection.
Connect Claude to Tableau and to Slack. Tableau’s MCP integration guide covers the Tableau side, and Claude’s Slack connector lets Claude post to the channels you choose. Your organization may require administrator approval for either connection.
Step-by-step workflow
- Connect Claude to your analytics environment. Configure the supported Tableau integration so Claude can access the relevant analytics information. See the links shared above for more information.
- Connect the Slack integration. Make sure Claude has an authorized way to post messages to the intended Slack destination.
- Open Claude. Start a conversation in an environment where the necessary tools and connections are available.
- Write a prompt describing the task. Specify the analytics information you want Claude to retrieve, the type of summary you need, and where you want the results delivered.
- Ask Claude to retrieve the information. Claude can use its configured tools to request the relevant data or analytics brief.
- Review the generated summary. Check that the results accurately represent the source data and answer your question.
- Send the summary to Slack. With the appropriate permissions, Claude can use the connected Slack tool to post the information to your chosen channel.
- Verify the message. Confirm that the summary appears correctly and includes the information your team needs.
Example Claude prompt
Here’s an example prompt:
Using the Tableau Cloud demo site, get the Pulse metric “Revenue” (TC Customer Dashboard) for month to date versus the same days last month. Break the change down by Category with a query of the Superstore data, and check that the category totals match the Pulse number. Post it to #push-demo as a short summary line, a one-sentence takeaway, and a table with columns Category, last month, this month, and Change (red ▼ or green ▲), with a source line ending “Posted by Claude.”
Here’s the result from our test environment:

This is an illustrative prompt from our test environment. Swap in your own site, Metric, and channel names.
Why use AI for this workflow?
Claude builds on the dashboards, Metrics, and data models your analytics team already maintains. That makes it a strong fit for recurring updates, and for decision makers who need a short explanation rather than a full dashboard.
How to Ask Slackbot Questions About Tableau Data
Not sure which dashboard holds the answer? Ask Slackbot. With the Tableau Next MCP turned on, Slackbot answers from your Tableau Next semantic model and returns a chart and a written explanation, right in Slack.
Before you begin
Your admins for Salesforce and Slack connect Slack to your Tableau Next org and activate the Tableau Next MCP server. Then, in Slackbot’s message box, click the apps (plug) icon and turn on Tableau Next MCP.
That toggle is necessary. Without it, Slackbot can fall back to raw Salesforce records, which may not match your dashboard. With it, answers come from the same governed model your dashboards use, and each person’s answers respect their own Tableau Next permissions.
Step-by-step instructions
- Open Slackbot with Tableau Next MCP turned on.
- Ask your question. In the video, I ask: “Using the Tableau Next MCP, what was total Bookings by product family in SDX Opportunity?” Naming the MCP makes clear which source you expect.
- Read the chart and narrative. In our test environment, Slackbot returned a horizontal bar chart of six product families, with Ignition and Electronics highest at $75.7M.
- Ask a follow-up question. I asked: “Break down Bookings by quarter for each product family.” Slackbot adds the time dimension and returns a new chart with its own narrative.
- Continue your questions, or take action with a workflow. Keep asking, or take action. Ask follow-ups until you have what you need. A Slack workflow can carry the result to the next step.
Example questions
Here’s the initial question asked:
Using the Tableau Next MCP, what was total Bookings by product family in SDX Opportunity?
From our environment, this is what that question returns without further instructions:
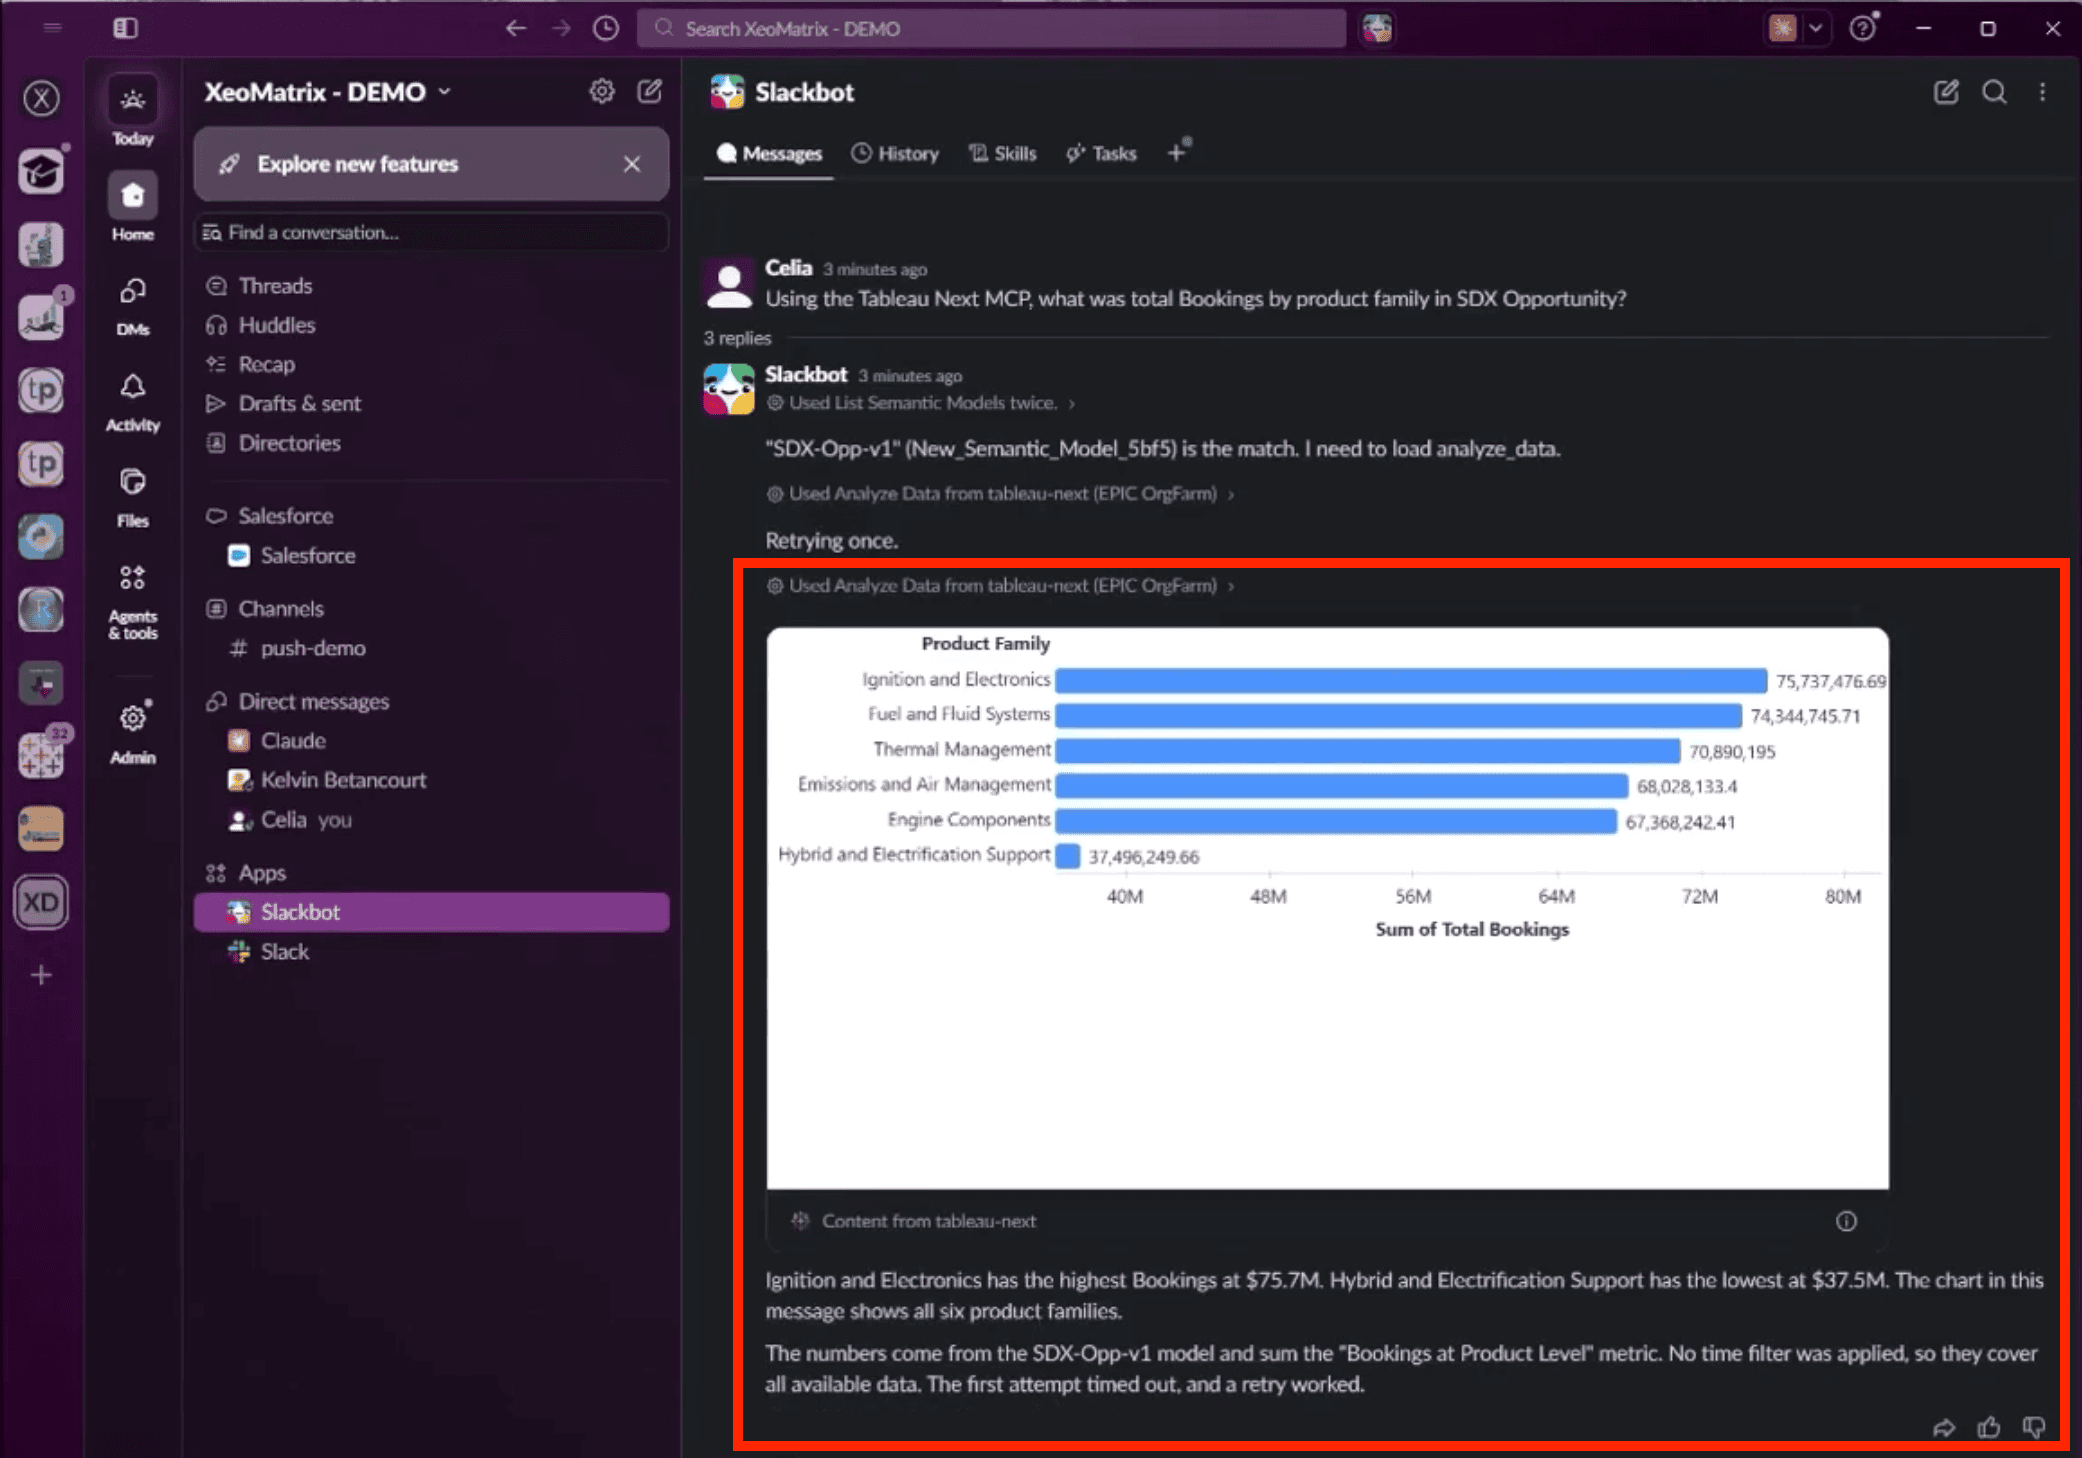
Slackbot’s response to the question includes a horizontal bar chart comparing six product families and a summary identifying Ignition and Electronics as having the highest bookings at $75.7M.
To dig in deeper, I say:
Break down Bookings by quarter for each product family.
The follow-up adds a time dimension, allowing users to see how bookings for each product family change from quarter to quarter.
Note that you start with the business question instead of the dashboard name, and refine as new questions come up. That opens analytics to everyone who knows the question but not necessarily where the answer lives.
Choosing the Right Approach
| Approach | Best for |
|---|---|
| Share a Tableau Next dashboard | Giving colleagues a complete, interactive view of business performance. |
| Share a Tableau Next metric | Highlighting a specific KPI or business result. |
| Use Claude with connected tools | Retrieving data, checking it, and posting a summary in one workflow. |
| Ask Slackbot questions | Exploring analytics conversationally and generating charts without leaving Slack. |
These approaches work well together: build and manage analytics in Tableau, collaborate around results in Slack, and use AI to make the answers easier to reach.
Make Analytics Part of Everyday Decisions
The goal is getting the right information to the right people while the decision is still open. Share a dashboard, highlight a Metric, let Claude deliver a summary, or ask Slackbot a question. Each one shortens the distance between finding information and acting on it, and the MCP routes do it without loosening the permissions and security you already rely on.
Ready to put AI to work?
XeoMatrix helps organizations speed up workflows and get faster insights by building the right data foundation through solutions engineering, implementation, integration, and enablement. Contact us for an AI Assessment.