Tableau has long been celebrated for its ability to transform complex data into captivating, easy-to-understand visuals. Its intuitive interface and powerful analytics capabilities have made it a go-to tool for data analysis across industries.
Tableau Pulse is a new feature that takes data exploration to a new level. Tableau Pulse leverages generative AI-powered insights so you can delve even deeper into your data, uncovering hidden trends and patterns that might have previously gone unnoticed.
Real-time tracking keeps you ahead of the curve with instant updates and alerts on business-critical data changes. Plus, seamless collaboration lets you share insights and work together within the familiar Tableau environment.
This guide will show you how to enable Tableau Pulse on your Cloud site.
Tutorial Video
How to Enable Tableau Pulse on Your Cloud Site
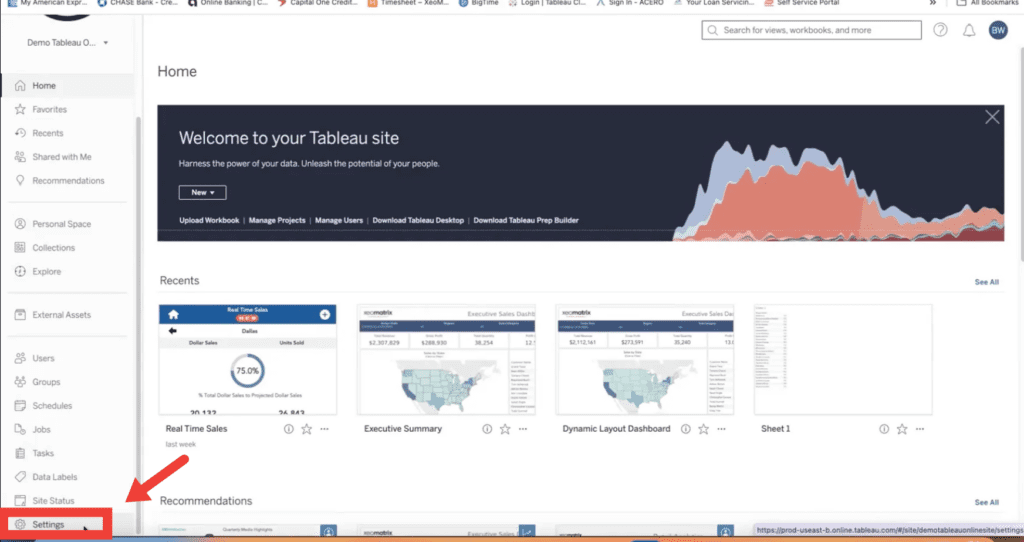
1. Access Cloud Settings
To begin, you can access the cloud settings by navigating to the Home page. You’ll find them conveniently located at the bottom of the left-hand taskbar.
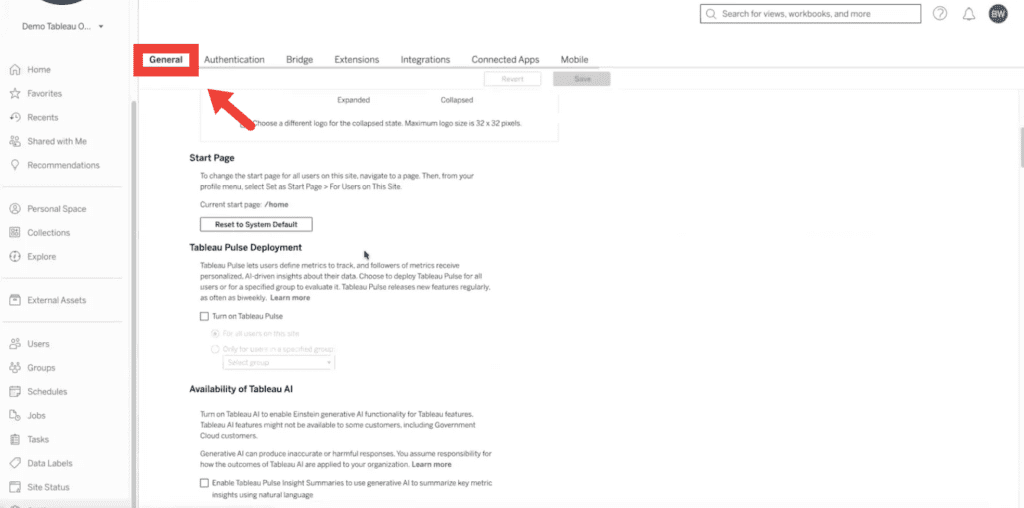
2. Navigate to the ‘General’ Tab
Once you’re in the settings, direct your attention to the ‘General’ tab. Here, you’ll discover a range of site configuration options.
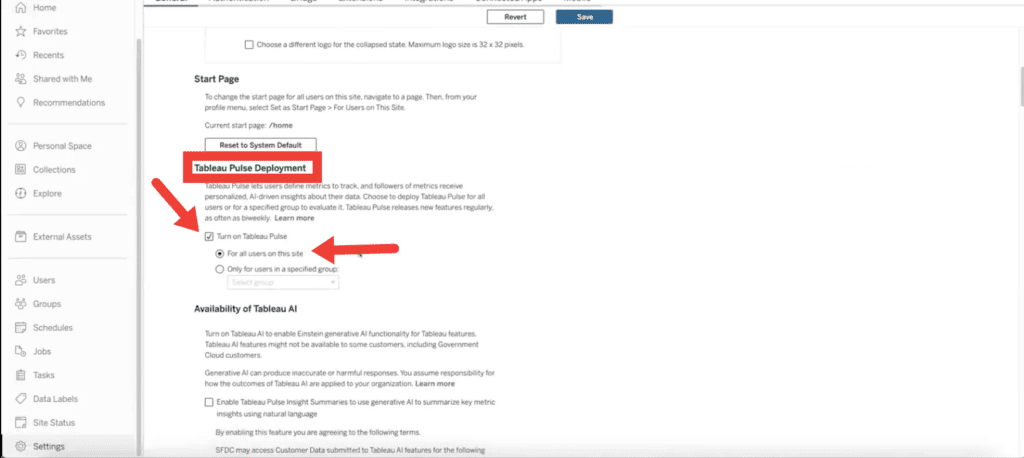
3. Enable Tableau Pulse Deployment
As you navigate through your general settings, continue scrolling down until you reach the ‘Tableau Pulse Deployment’ section. Here, you’ll find the option to ‘enable Tableau Pulse.’
While this feature is accessible to all users on your site by default, you have the option to restrict access to specific groups. This provides you with more control over which team members can access it.
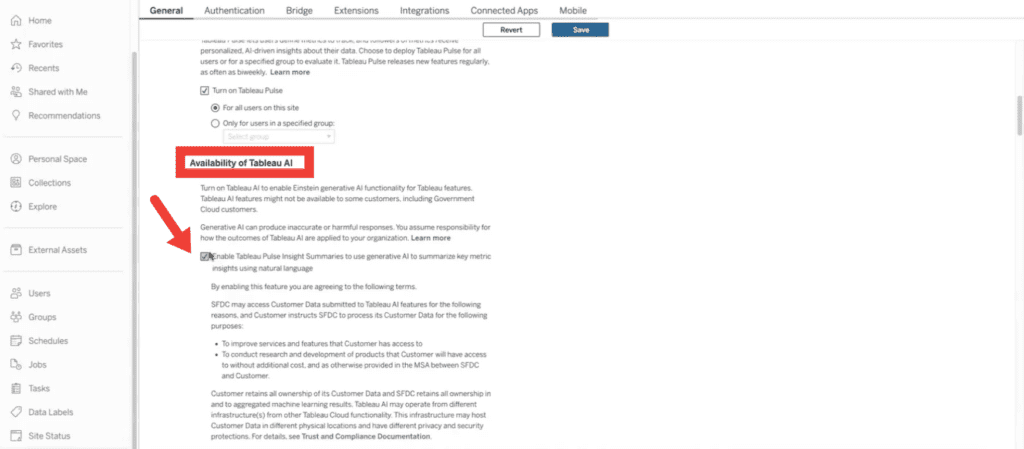
4. Access Pulse Insights
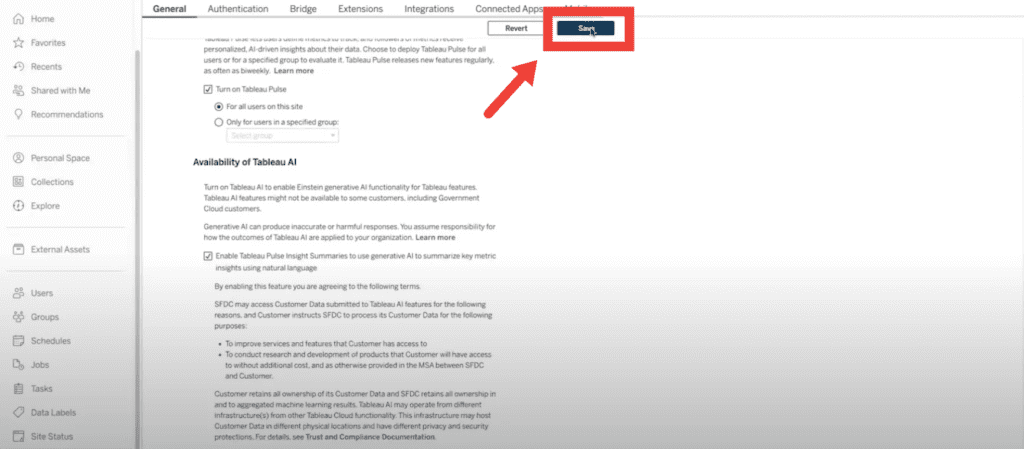
Next, scroll down to ‘Availability to Tableau AI’ and click the box that reads ‘Enable Tableau Pulse Insight Summary.’ Once you’ve clicked the box, hit save in the top right-hand corner of your screen.
Hit ‘Save’.
A new option labeled ‘Tableau Pulse’ will appear on the left-hand side. Click on this next.
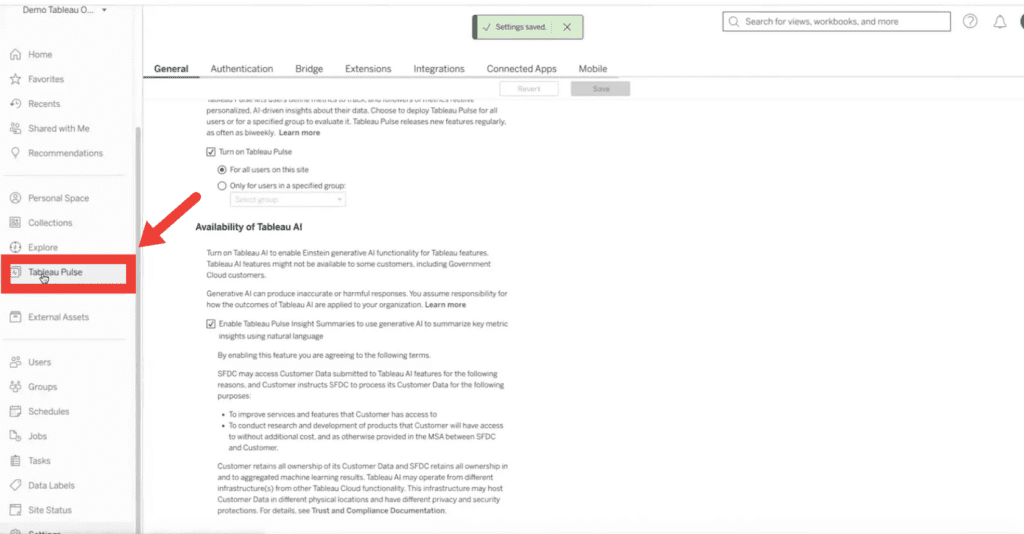
5. Set up Pulse Insights
After clicking on ‘Tableau Pulse’ in the taskbar, you’re all set to configure your Pulse Insights. In this example, we’re already following a Pulse Insight for Revenue.
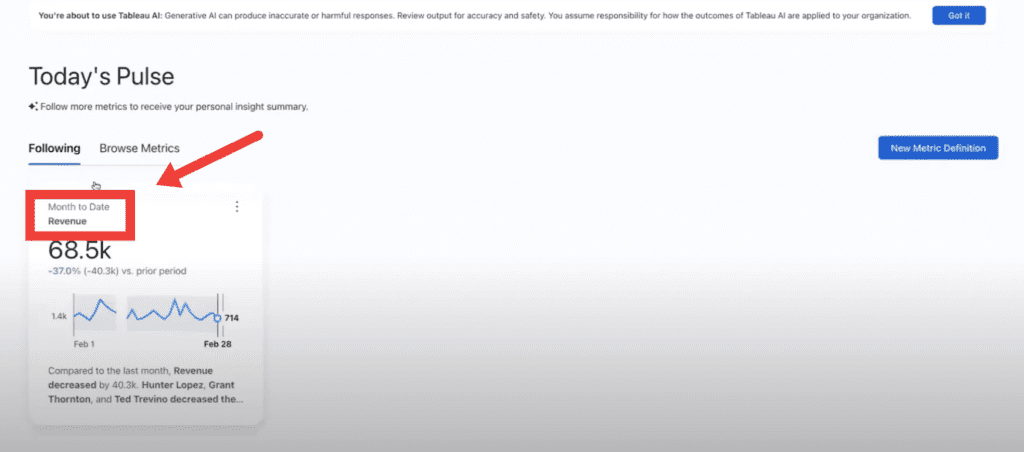
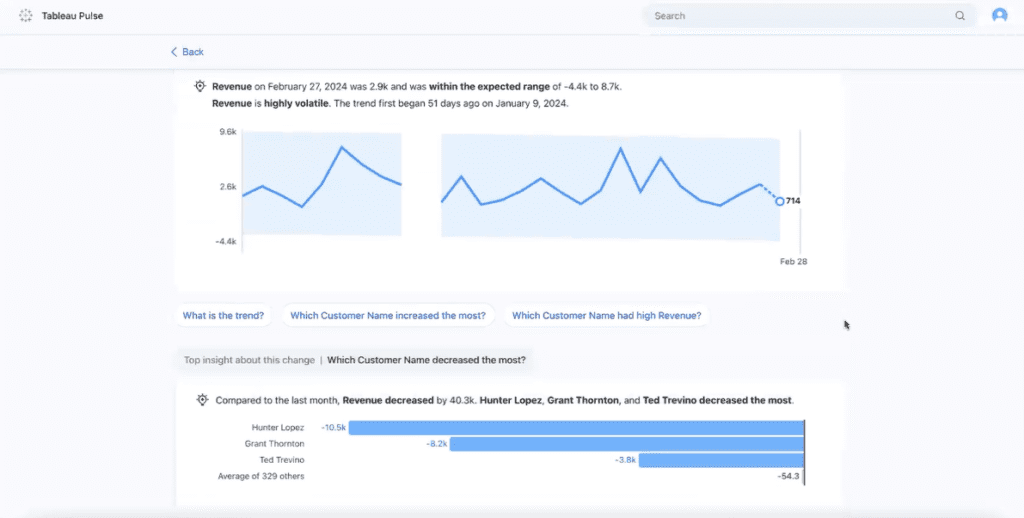
6. Explore Insights
Once you click on a Pulse Insight, you’ll gain access to a general overview of the metric for a specific period of time. In this example, we can see the sample data over the month of February.
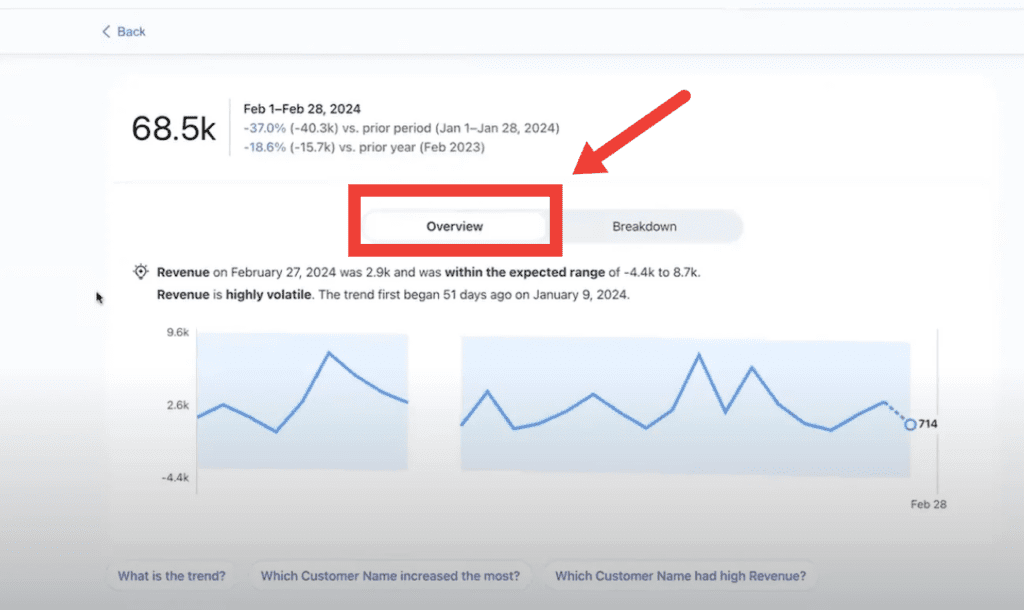
In this example, when you click on the ‘Overview’ button and scroll down, you’ll see valuable insights like ‘which customer name increased the most’ and ‘which customer name decreased the most.’
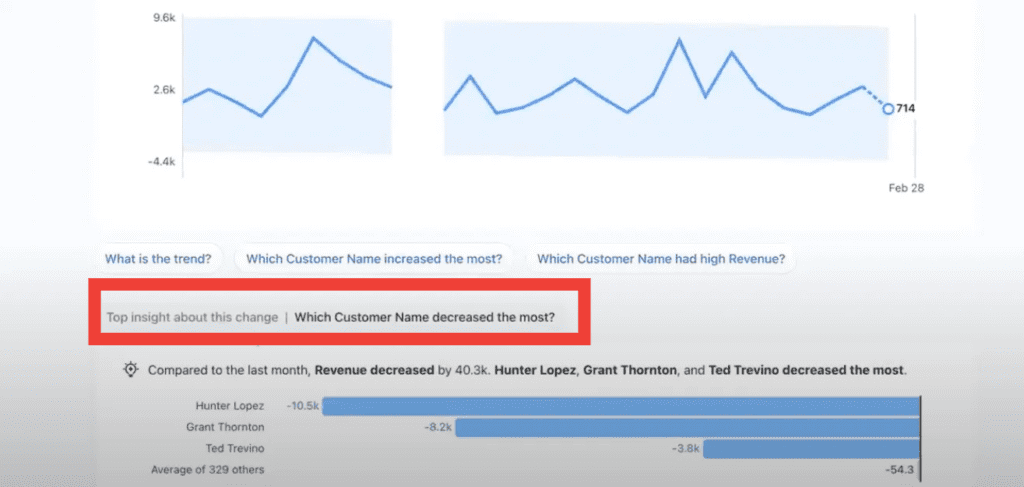
To see even deeper insights, click ‘Breakdown’ next to the ‘Overview’ button. This section will show revenue by customer name and more granulated answers to the same questions under ‘Overview.’
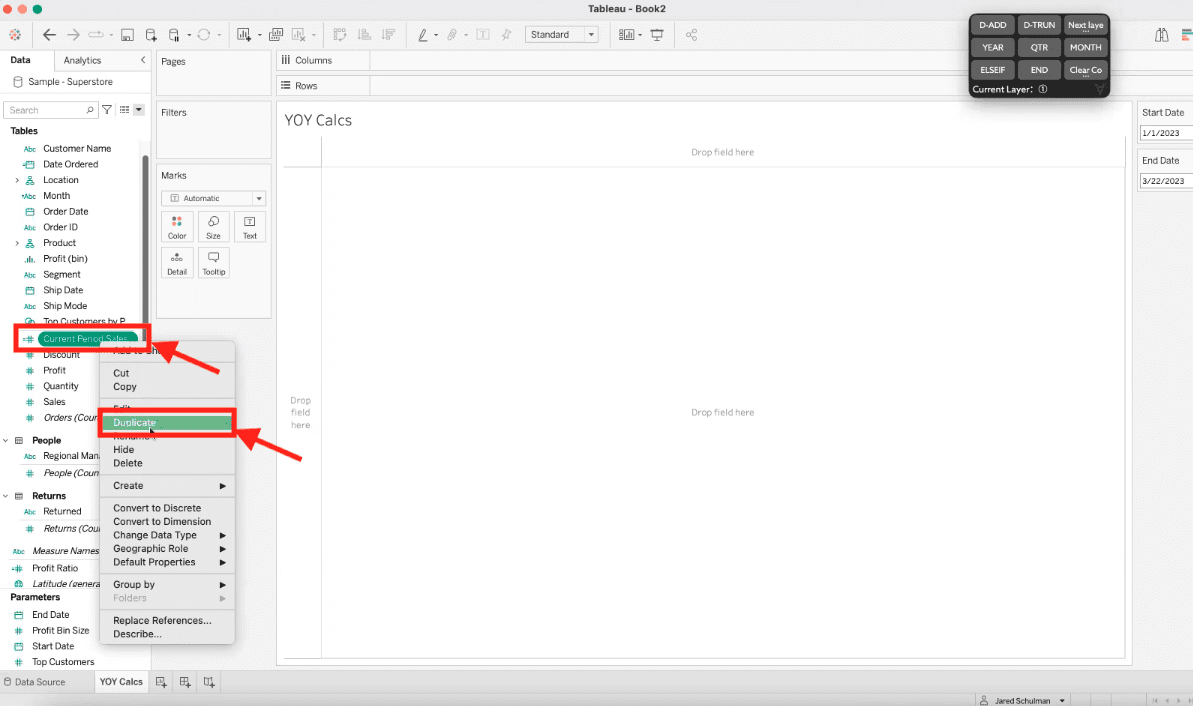
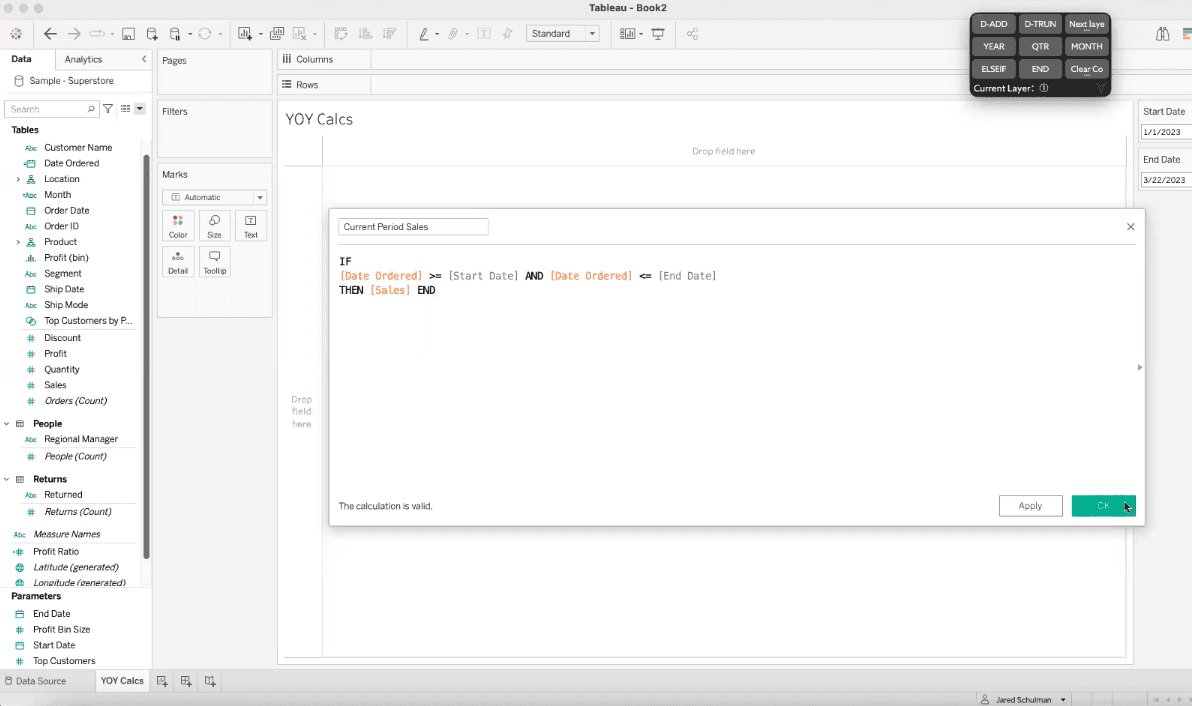
7. Set up a New Metric
In the top right-hand corner of the screen, click the three horizontal dots, then click ‘Edit Definition.’
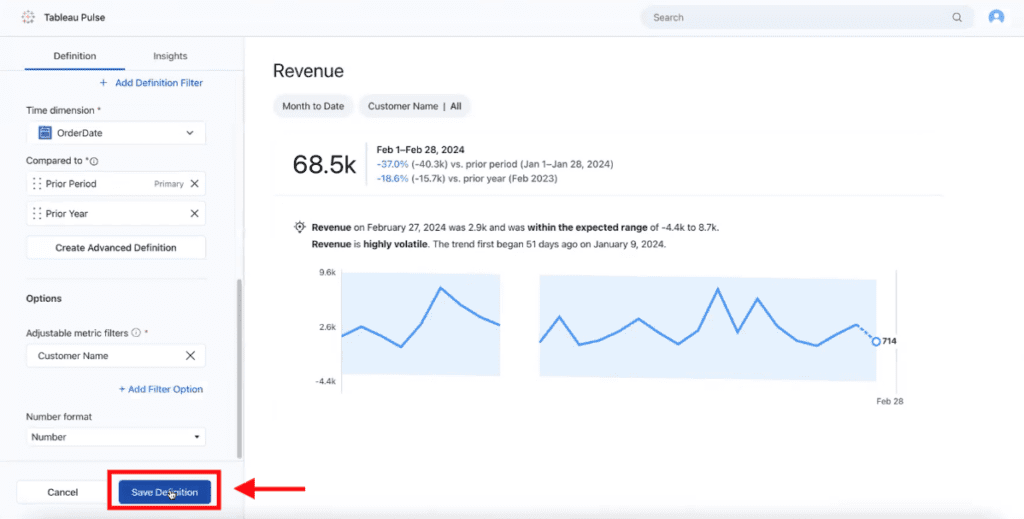
In the left-hand column, you’ll see the details for your Data Source. Below, add the ‘Name’ and ‘Description’ of your new metric.
Then, in the ‘Value’ section, select the metric measure from the list of options. This metric should match the name you provided.
Lastly, select your ‘Values’ according to your new metric. In this example, for Revenue, we are choosing ‘Aggregation: Sum’ and ‘Time Dimension: OrderDate.’
Once you’ve chosen your preferred options, click the ‘Save Definition’ button.
Activate Tableau Pulse on Your Cloud Site with XeoMatrix
As you enable Tableau Pulse on your cloud site, you may have questions about which metrics to include and how to view data to provide meaningful insights for your organization. XeoMatrix is here to help you. Our Tableau expertise ensures a smooth integration of Tableau Pulse with your cloud infrastructure, tailored specifically to your needs.
With XeoMatrix, you’ll receive personalized guidance to maximize the utility of Tableau Pulse, transforming your data into actionable insights with ease.
About XeoMatrix
At XeoMatrix, we specialize in providing comprehensive data and analytics consulting services aimed at empowering businesses to gain deeper insights from their data.
Our proven methodology simplifies the development process, allowing our clients to concentrate on analyzing their business trends effectively. By streamlining data visualization, we pave the way for enhanced decision-making and ultimately, improved ROI.
Reach out to us today to discover how our tailored business intelligence and data warehousing solutions can drive your business forward.