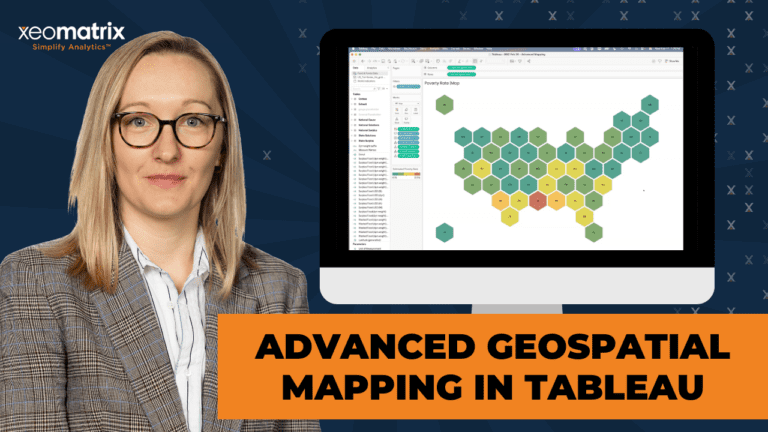
Advanced Geospatial Mapping in Tableau (On-Demand Webinar)
Learn advanced geospatial mapping in Tableau, including Mapbox customization, spatial files, map layers, and WMS techniques.

Learn advanced geospatial mapping in Tableau, including Mapbox customization, spatial files, map layers, and WMS techniques.
Learn dynamic zone visibility in Tableau to reuse dashboard space, switch views, and deliver deeper analysis with cleaner layouts.
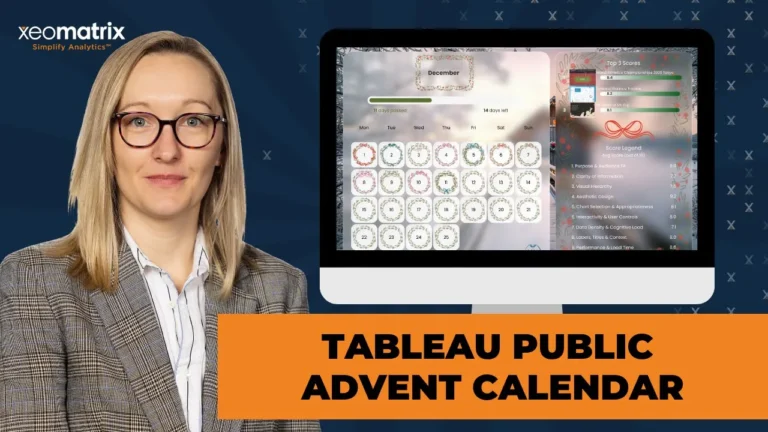
Learn how to build a Tableau Advent Calendar dashboard using Map Layers, Dynamic Zone Visibility, and interactive design.

Explore how Tableau Next integrates seamlessly with Salesforce and introduces powerful new features like the semantic model and Tableau Concierge, reshaping how teams build, embed, and interact with analytics.
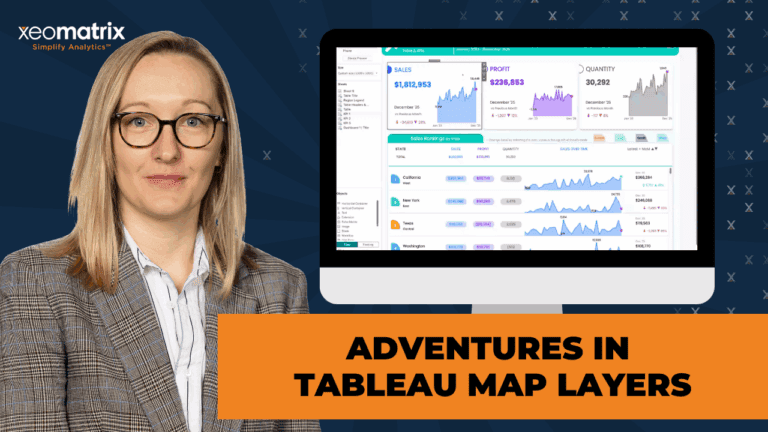
Learn how Tableau expert Lauren Cristaldi uses Map Layers to build creative, high-performance dashboards with precision layouts, dynamic KPIs, and innovative visual techniques.
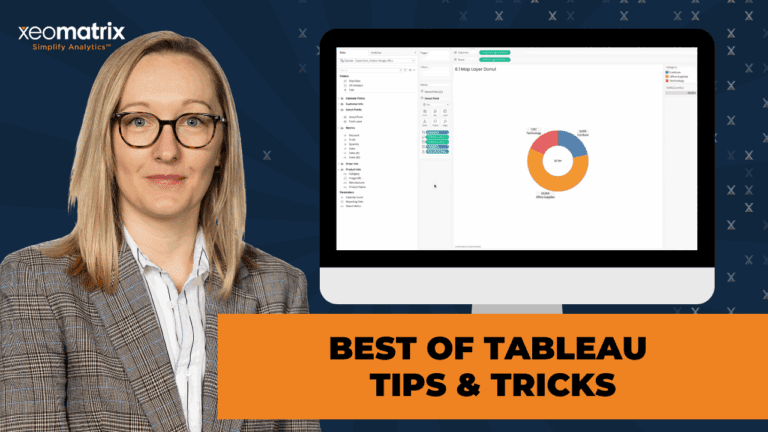
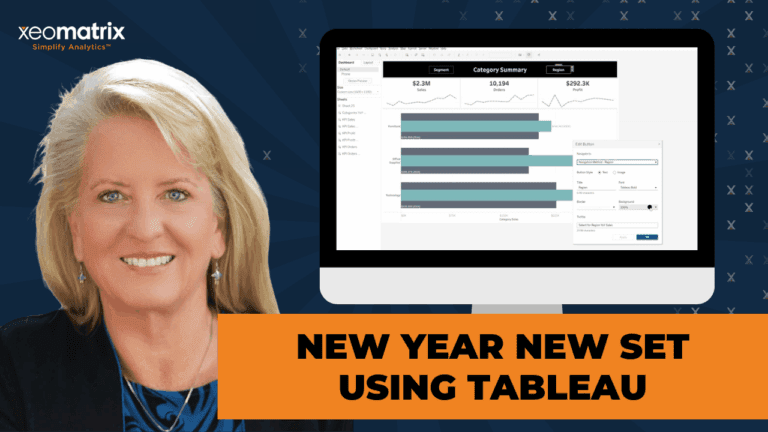
Discover practical Tableau tips & tricks to save time, boost performance, and create polished dashboards with clever formatting, sets, and creative visuals.
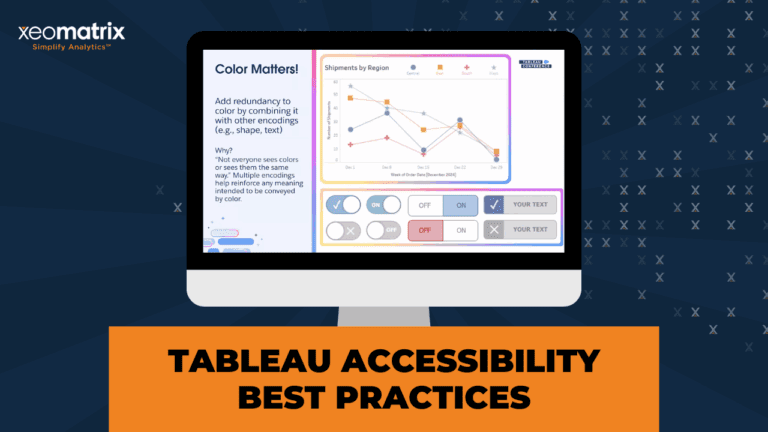
Learn how universal design principles and accessibility practices can make Tableau dashboards more usable, inclusive, and effective for all users.
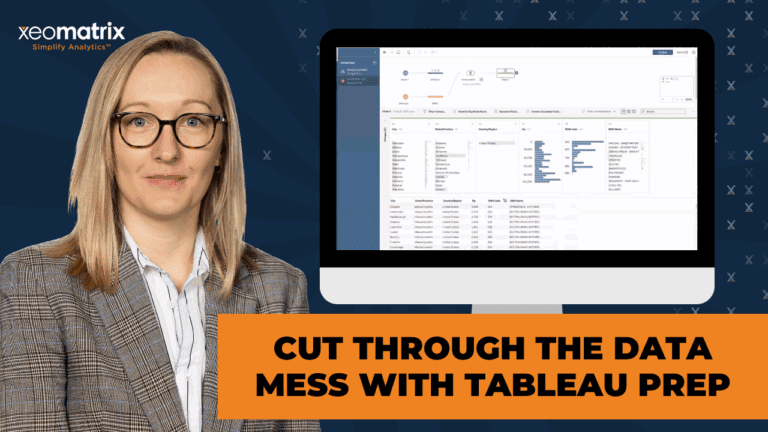
Learn how to clean, combine, and transform messy data with Tableau Prep—from naming steps clearly to publishing flows and handling Google Sheets, joins, pivots, and on-prem SQL challenges.
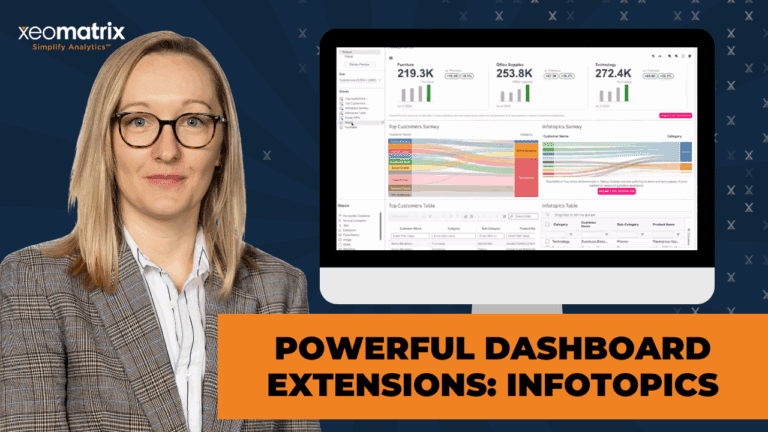
Discover how InfoTopics Viz Extensions supercharge Tableau dashboards with advanced visuals like Sankeys, KPIs, Sunbursts, and more—no complex calculations required. In this session, Lauren Cristaldi demos powerful tools that save time and elevate design.
Learn how to create a reusable Tableau chart catalog with templates for donuts, waterfalls, KPIs, and more—plus design tips using Figma and time-saving Tableau techniques.
In this session, we explore advanced formatting in Tableau using Figma for layout prototyping. While Figma is typically a graphic design tool, it provides templates, UI kits, and wireframes that are highly useful for Tableau users to build polished dashboards.
Discover smarter Tableau filtering techniques, including context filters, action filters, and dynamic zone visibility, to optimize performance and interactivity in your dashboards.
Discover advanced Tableau mapping techniques with Lauren Cristaldi from XeoMatrix. Learn how to leverage spatial files, create custom map layers, perform spatial calculations, and build unique visualizations like hexbin maps and dynamic data-driven gauges.
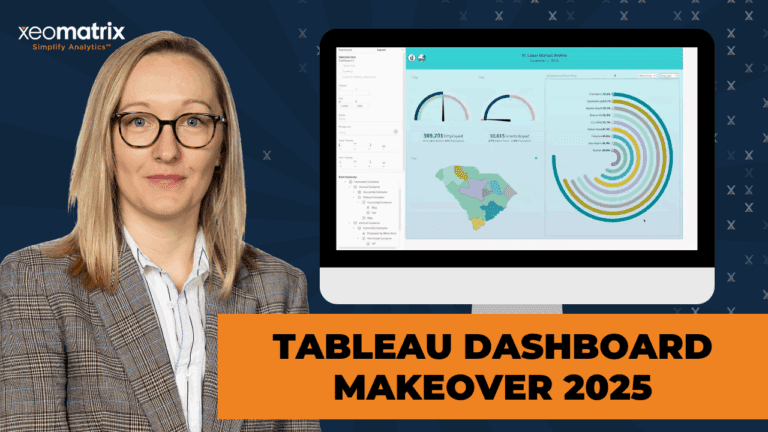
Explore the transformation of a Tableau dashboard with modern features and best practices, showcasing actionable strategies to elevate data visualization and interactivity.
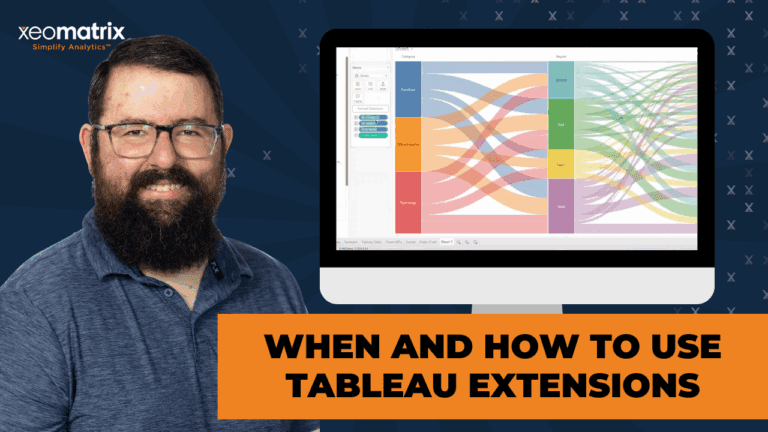
Discover how Tableau Extensions like Sankey diagrams, Sunburst charts, and Tableau Tables simplify advanced visualizations and customizations, unlocking powerful insights with ease.
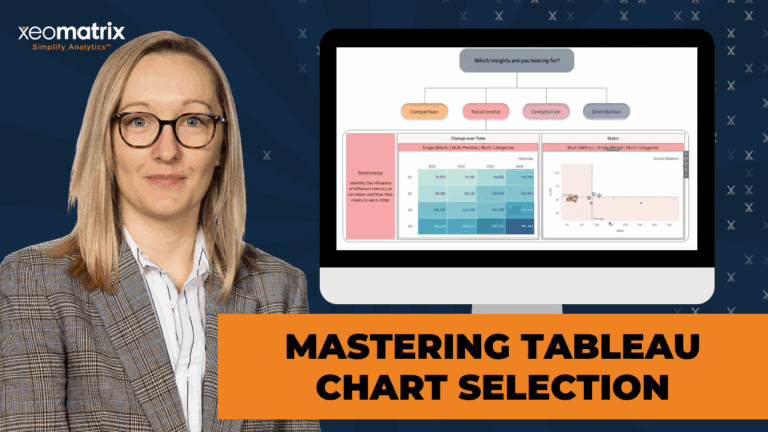
Learn how to choose and build the right Tableau visuals to answer analytical questions effectively. Explore comparison, relationship, composition, and distribution chart types in detail.

Learn advanced Tableau dashboard formatting techniques, including custom shapes, color palettes, gradient backgrounds, containers, and reusable templates to create visually appealing dashboards.
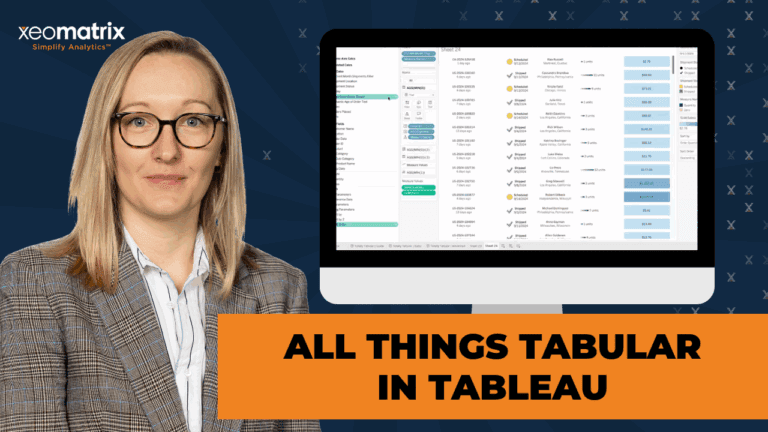
The session, titled All Things Tabular in Tableau, provided a detailed walkthrough of creating advanced tables and tabular visualizations in Tableau. Lauren Cristaldi led the live demonstration, highlighting best practices for transforming basic tables into visually engaging and functional reports.