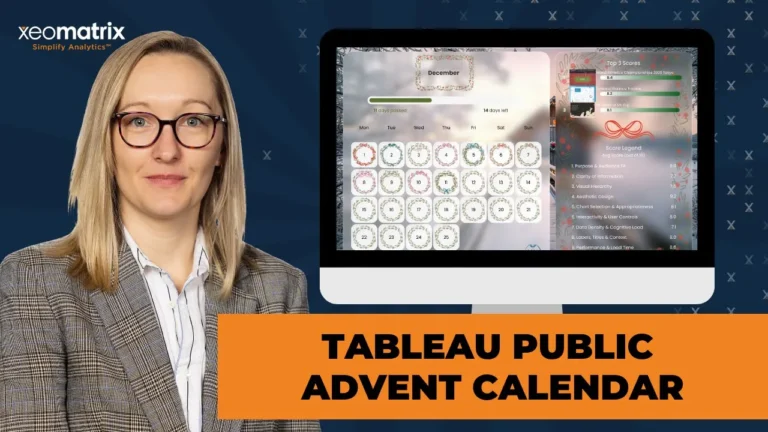
Tableau Public Advent Calendar (On-Demand Webinar)
Learn how to build a Tableau Advent Calendar dashboard using Map Layers, Dynamic Zone Visibility, and interactive design.

Learn how to build a Tableau Advent Calendar dashboard using Map Layers, Dynamic Zone Visibility, and interactive design.

About the Event Kick off the new year by leveling up your Tableau dashboards with smarter interactivity. In this webinar,

Celebrate the season with data! Join us Wednesday, December 10th at 12 PM Central to explore our favorite Tableau Public dashboards in a fun, interactive advent calendar.

Discover highlights from TableauNext and see a live demo of Tableau’s Semantic Layer and Salesforce integration. Join us Wednesday, November 12th at 12 PM Central.
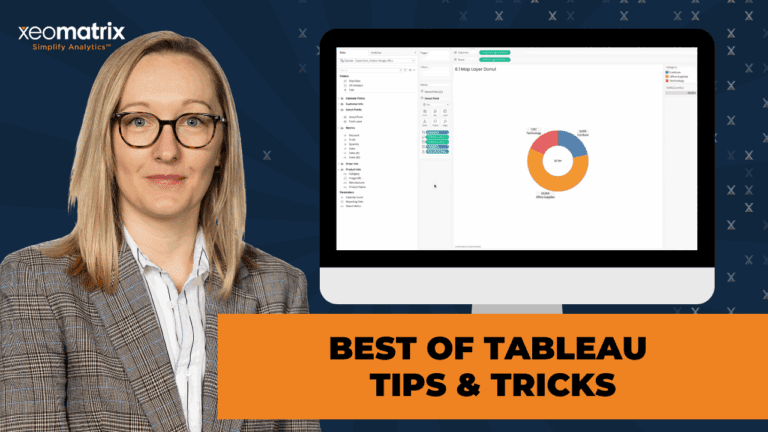
Discover practical Tableau tips & tricks to save time, boost performance, and create polished dashboards with clever formatting, sets, and creative visuals.

Discover how to transform Tableau map layers into tables, donuts, KPIs & more in this hands-on webinar with XeoMatrix Lead Consultant Lauren Cristaldi.

About the Event Join us for a deep dive into our favorite Tableau Tips & Tricks! In this session, we’ll
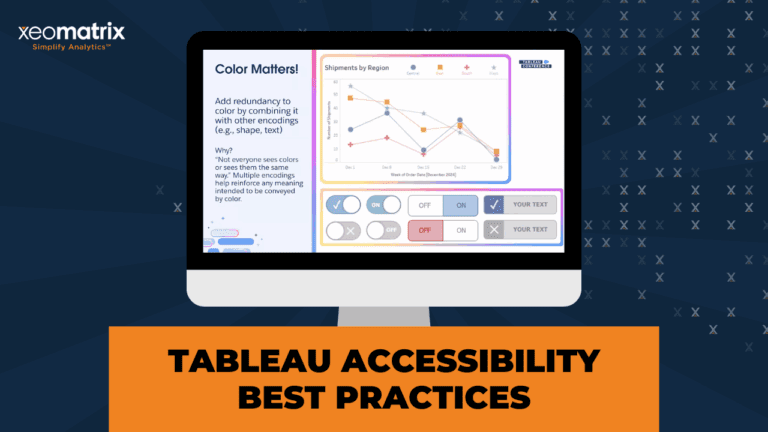
Learn how universal design principles and accessibility practices can make Tableau dashboards more usable, inclusive, and effective for all users.

Accessibility Matters: Universal Design Means Data for All – Learn to build inclusive dashboards. Join us on August 13th at 12 PM Central to make data accessible to everyone.
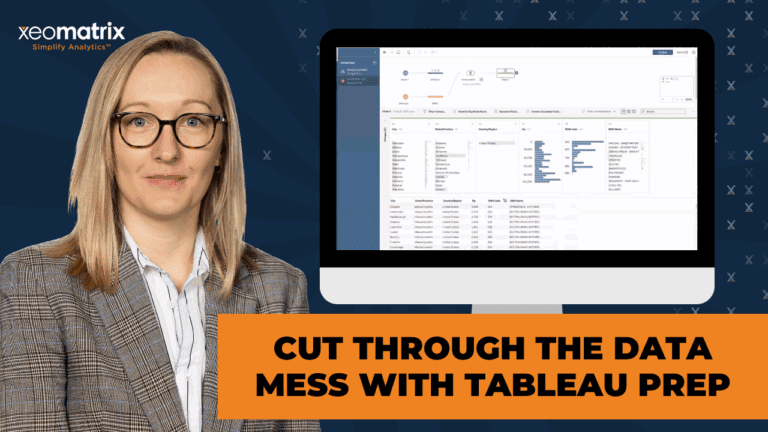
Learn how to clean, combine, and transform messy data with Tableau Prep—from naming steps clearly to publishing flows and handling Google Sheets, joins, pivots, and on-prem SQL challenges.
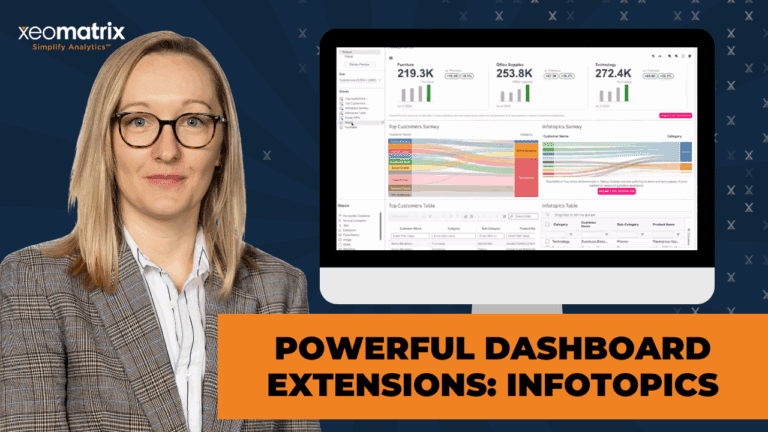
Discover how InfoTopics Viz Extensions supercharge Tableau dashboards with advanced visuals like Sankeys, KPIs, Sunbursts, and more—no complex calculations required. In this session, Lauren Cristaldi demos powerful tools that save time and elevate design.
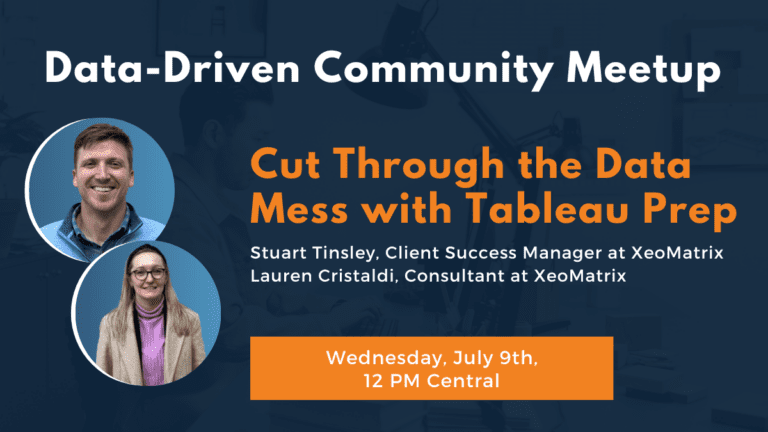
Learn how to clean and organize messy data using Tableau Prep. This webinar covers tips for combining Excel files, fixing inconsistencies, and preparing your data for analysis—fast and without code.
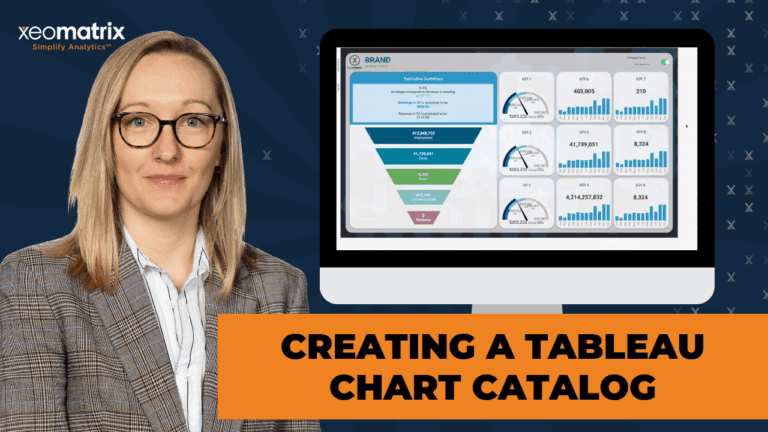
Learn how to create a reusable Tableau chart catalog with templates for donuts, waterfalls, KPIs, and more—plus design tips using Figma and time-saving Tableau techniques.

Join us on Wednesday, June 11th at 12 PM CT to explore powerful Tableau dashboard extensions! Learn how to boost interactivity and see our favorite InfoTopics tools in action—perfect for taking your dashboards to the next level.
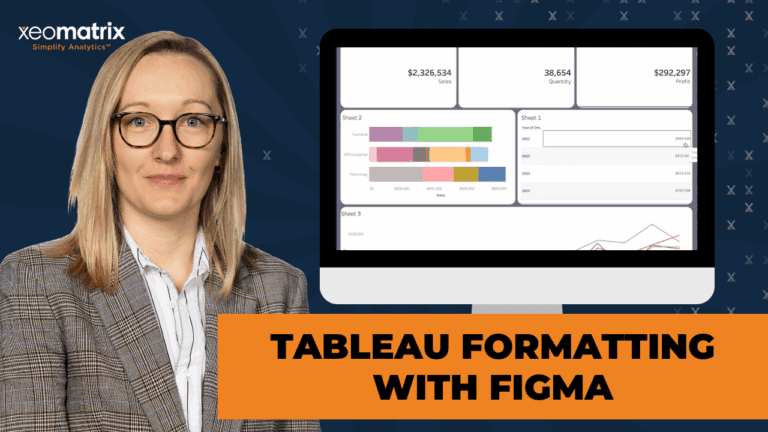
In this session, we explore advanced formatting in Tableau using Figma for layout prototyping. While Figma is typically a graphic design tool, it provides templates, UI kits, and wireframes that are highly useful for Tableau users to build polished dashboards.
About the Event Speed up your dashboard development process with a custom chart catalog! In this webinar, we’ll show you
Learn Tableau Formatting with Figma to create polished dashboards with custom backgrounds and layout best practices.
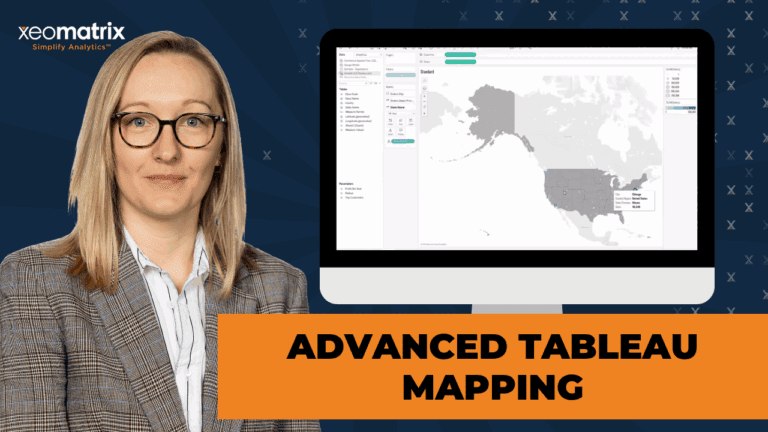
Discover advanced Tableau mapping techniques with Lauren Cristaldi from XeoMatrix. Learn how to leverage spatial files, create custom map layers, perform spatial calculations, and build unique visualizations like hexbin maps and dynamic data-driven gauges.