Tableau offers several built-in background map styles, but those options are limited when you need tighter control over colors, typography, or overall visual tone. When branding or design consistency matters, custom Mapbox maps allow you to go beyond Tableau’s defaults and apply fully customized map styling.
In this guide, you’ll learn how to select a Mapbox style, customize it, and add it as a background map in Tableau using Mapbox.
Tutorial Video
Show/Hide Transcript
Lauren Cristaldi: [00:00:00] Hi, this is Lauren Cristaldi with XeoMatrix, and today I’m gonna show you how to use Custom Mapbox Maps in Tableau.
So from here we can see that in Tableau desktop, i’ve pulled in the Region from Sample Superstore Data, and it’s kind of auto built this map where we have that kind of gray scale view that would be the light style. So when we go in to edit the background layers, this toolbar comes up on the side, and this is all of our options to customize the default further. So you can go to normal, dark, streets, outdoors.
But, let’s say you wanna change like this blue or the green, or even the font to be different or more on brand with your own like style guide that you may have. Well, we [00:01:00] can’t really do that within Tableau, but we can do that in Mapbox.
So if we go to mapbox.com and you’ll have to create an account, it’s free if you’re just using things from the gallery or you’re not adding any other like custom layers. But if we go to the gallery and then let’s select like blueprint. We’ll preview this style. Add to your studio.
Now we can see in the left we have all of these different options for the different layers that are being brought in where you can change the color or the font, even the size. We have a lot of different options here that we didn’t have before. [00:02:00] And just to preview this one from the gallery, without those changes that we may wanna make, if you go up to Share and then under Developer Resources, you go to Third Party and then we’re gonna copy this integration, URL. Copied.
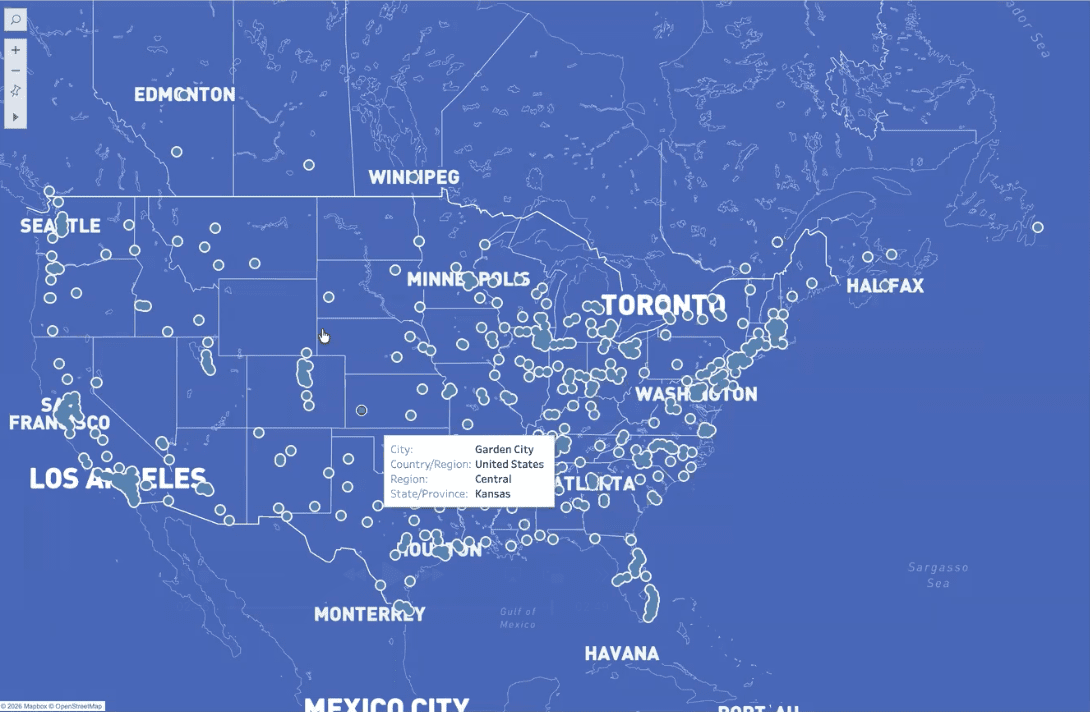
We’ll go back to Tableau. Go up to Map, Background Maps, and then we’ll add this Mapbox Map. We can call this Blueprint, or it can be another name. It doesn’t have to match the exact style name that’s in the gallery. Then we’ll paste that URL we just copied and now we have that Custom Formatting applied.
Step-by-Step Guide to Use Custom Mapbox Maps in Tableau
1. Start with a map view in Tableau
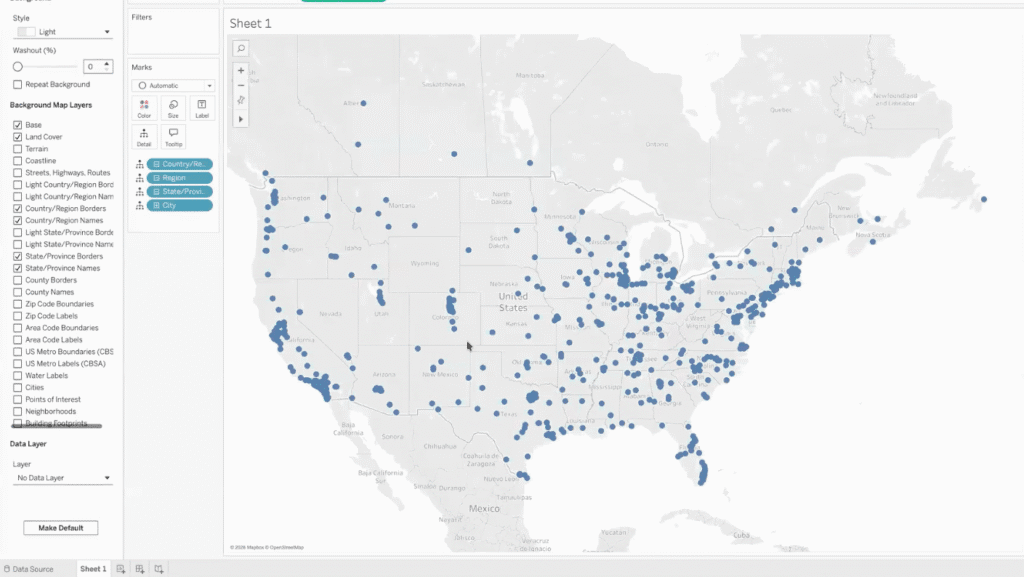
Open Tableau Desktop and create a map using your geographic field. In this example, the map is built using the Region field from a Sample Superstore dataset.
At this point, Tableau automatically applies one of its default background maps.
2. Review Tableau’s default background map options
Open the Background Layers settings to view Tableau’s built-in map styles, such as Light, Normal, Dark, Streets, Outdoors, and Satellite.

These options are useful for quick styling, but they don’t allow deep customization of fonts, colors, or map layers, especially if you’re trying to match a brand or design system.
3. Open Mapbox and browse the Gallery
Navigate to Mapbox.com and log in to your account.
From there, open the Gallery, which contains a variety of prebuilt map styles.
In this walkthrough, we use the Blueprint style as an example, but any Gallery style can be selected. Click on “Preview Style”.

4. Add a Gallery style to your Mapbox Studio
Once you’ve chosen a style, add it to your Mapbox Studio. This makes the style editable and available for integration with external tools like Tableau.

Important: Adding the style to Studio is required before you can generate the integration URL that Tableau needs.
5. (Optional) Customize the map style in Mapbox Studio
Inside Mapbox Studio, you can customize elements that Tableau does not expose, including:
- Colors and contrast
- Label fonts and sizes
- Visibility of map layers (roads, boundaries, landmarks)

This step is optional, but it’s where Mapbox provides the most value if you need advanced visual control.
6. Copy the third-party integration URL from Mapbox
Open the Share options for the map.
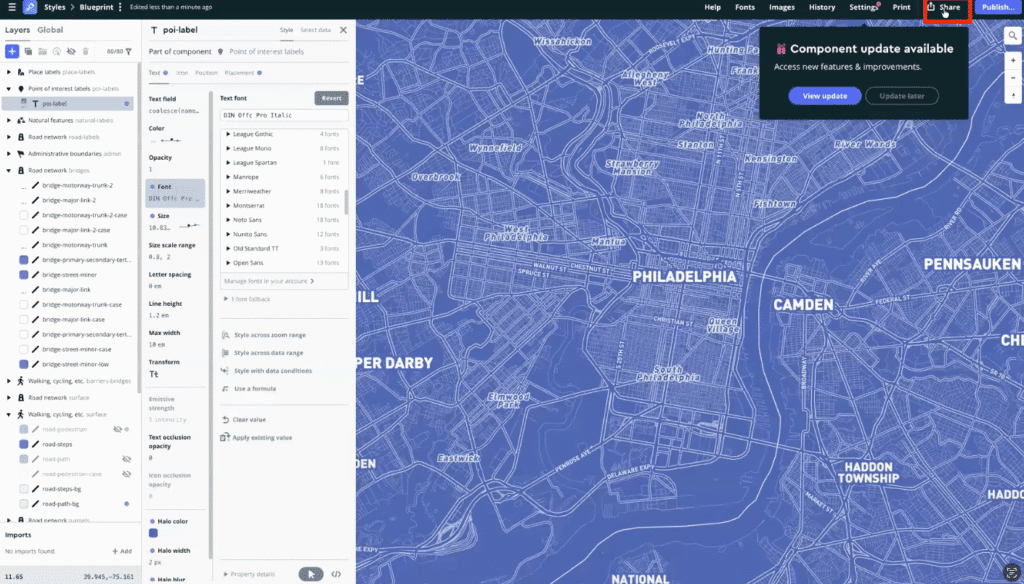
Navigate to Developer resources. Under the Third party section, copy the integration URL.

This URL is what Tableau uses to pull in your custom Mapbox map.
7. Add the Mapbox map as a background map in Tableau
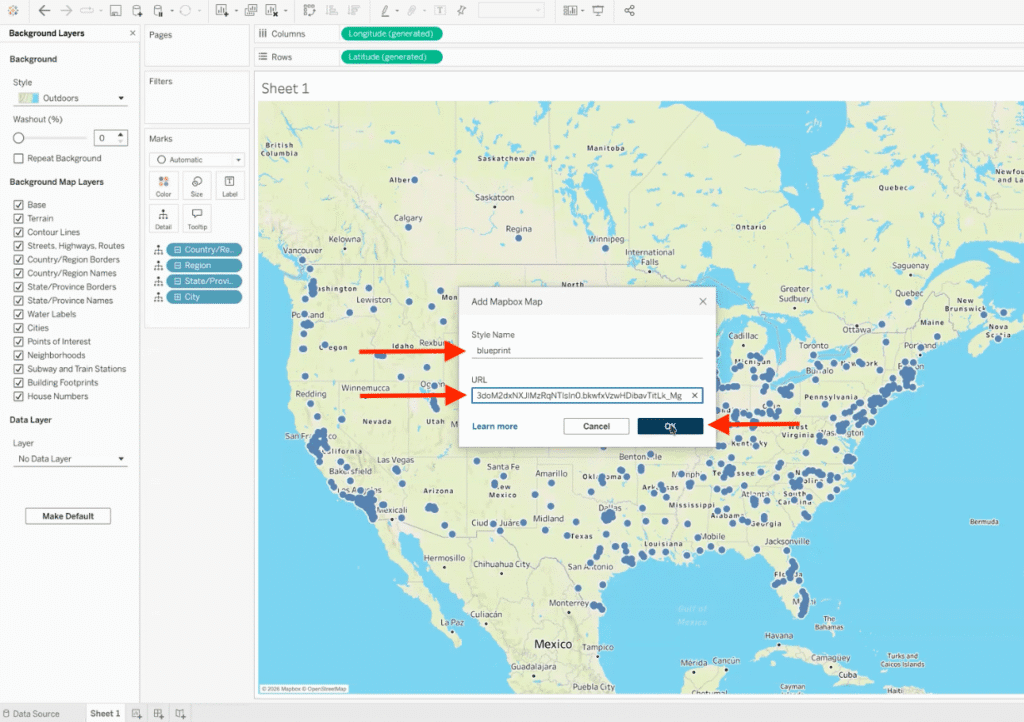
Return to Tableau and open Map → Background Maps → Add Mapbox Map.

Give the map a descriptive name (it does not need to match the Mapbox style name exactly), then paste the integration URL into the dialog and confirm.
8. Apply and verify the custom map styling
Once added, select the new Mapbox map as your background map. Tableau will immediately apply the custom styling to your worksheet.

At this point, your map is using Mapbox’s formatting rather than Tableau’s default basemap styles.
Want Help Designing More Polished, Brand-Aligned Tableau Maps?
At XeoMatrix, we help teams move beyond Tableau’s default map styles and create geographic visualizations that are clearer, more intentional, and easier to use. Whether you’re refining an existing dashboard or building a new one from scratch, our team can help you apply advanced mapping techniques, like custom Mapbox basemaps, in a way that fits your data, your brand, and your users. Get in touch with XeoMatrix to talk about your Tableau mapping strategy.