Analytics is changing. As generative AI reshapes how we explore data, the challenge is no longer just building insightful dashboards, it’s about encoding business context and domain language into a well-defined Tableau Next semantic data models.
What happens when:
- Your data model lacks clear definitions and business context?
- Cross functional teams use different terminology for the same metric?
- Generated insights fall short in the absence of well-defined logic?
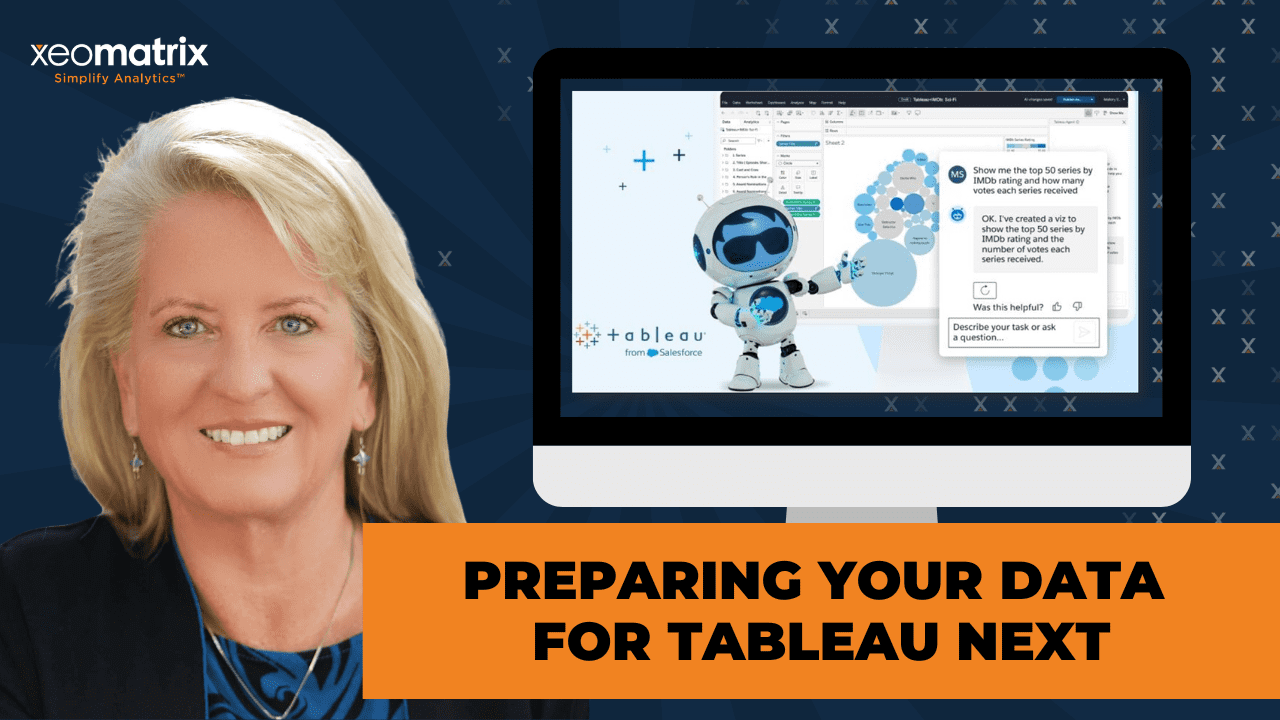
Celia Fryar, XeoMatrix’s Training and Enablement Lead, walks through this shift in Meaning Before Metrics: Preparing Your Data for Tableau Next, a Data Driven Community session focused on new features designed to assist analysts prepare the semantic data model within Tableau Next. Ultimately, the session was about establishing a semantic foundation that drives accurate, trustworthy analytics.
See how a meaning-first approach to data preparation unlocks the full potential of AI-enabled analytics:
- Define semantic models grounded in real business context.
- Apply business rules to create shared, consistent language.
- Use AI-assisted tools to accelerate development without sacrificing accuracy.
This isn’t just about conversational analytics, it’s about building a foundation where data, logic, and language align to create trusted, meaningful insights.
Explore the recap to see how these concepts are coming together in Tableau Next.
Watch Preparing Your Data for Tableau Next
>> CELIA FRYAR: I just want to thank you guys for making time to be here today. This is the part two in a series that the third occasion will be in June, approximately. It’s what I’m expecting, June or July. This has been a year journey of participating in Tableau’s Tableau Next and affiliated features and products around it, their beta program. I’m looking forward to sharing with you an update on what I started in November. We will get started with that in just a second here. As you know, this is the data-driven community webinar that we do monthly. Lauren Cristaldi and I lead it together. Lots of times, it’s Lauren presenting. I hope you guys are able to just relax and enjoy your lunch or something. I’m happy to share with you an update on what I’ve learned very much has circled around this idea of meaning before metrics. When I first got introduced to Tableau Next, it became very clear to me really quickly that it was going to rise and fall on that semantic data model. What they’ve done with the development of it has been pretty exciting this year. I’m going to be diving into that. This is styled as a regular Zoom meeting. We have it configured where folks can, with our agreement, share their screens and come off mute and chat. Along with that, I just want to thank you for being conscious of any sounds that might be coming in from your side as well.
There will be an email that will come out. We’ll have a chance for Q&A at the end. There will be an email that will come out on Friday with a recording. Also, by then we’ll have a tips and tricks kind of thing put together as well, because I actually am going to be demoing live today. Which, all by itself, should tell you something about what I think about the stability of the project, because back in November, I used pre-recorded little segments to share and show. That will come out to you on Friday.
My co-host is Lauren Cristaldi. She’s an incredible human who runs our– she’s a manager of data analytics team at Xeomatrix. She has this incredible eye for seeing how to put things together in a way that it’s appealing, engaging, and most performant methods that are available at any moment in time. She’s also certified on the Salesforce side of the house. I’m Celia Fryar. I’ve been in data my full career, have been in and around Tableau for 15 years now, but been teaching it for 10. It has been my honor and privilege to walk alongside of people as they pivot into data analytics for the most part.
Tableau has figured largely into that. I’ve also been serving as an adjunct professor at University of San Francisco. Kind of getting to see the breadth of people engaging in analytics and now AI as well to try to help. I’m always encouraging folks to apply it in any spaces possible because it’s every generation, every decade, I would say, rather than generation. Every decade has had some new, amazing thing that we have had to incorporate as analysts, and the data science models that were supposed to take everybody’s jobs have certainly empowered a lot of people’s jobs. The latest wave now is what’s happening with AI agents and how much is that going to change the workflow that we all experience? We’ll see.
I feel like there’s a really incredible leader that I follow who is, I met him about 20 years ago, but he’s been at Google and presently is IBM. He spent some time at Microsoft as well. One of the things he recently was quoted saying was that we’re going to tend to expect too much from AI right now, but underestimate it in the long run. It’ll be interesting to see where the balance is and what our role is to really leverage it to our advantage, but not to yield our thinking over to it.
With the younger crew that I work with at University of San Francisco, I’m often encouraging them to focus on being great prompt engineers and also making sure that they own that domain expertise, because that part is essential for us to own. All right. With that, let me switch over to my other deck.
>> [PAUSE 00:04:36]
We started this in November. There was a beta last summer from May until about September timeframe that really got it kicked off. The first general availability for Tableau Next went to market. Then, along with that, we had the second phase of the beta, which I think it technically began late December. For me, I didn’t have the space and time to get into it until closer to February. It’s been really interesting to see how this is being how it’s growing and evolving. Some of the key things that I think are worthy to focus on is– What we started with last November was a demonstration of how we can, from a Salesforce workflow point of view, we can integrate Tableau Next dashboards into that same workflow.
People like to complain about Salesforce, the type of analytics that’s available there. Well, Tableau Next most definitely can take that to the next level. It’s going to be painful for them if they have to leave the workflow, go someplace else with analytics, and then go back to their regular space. Being able to embed that into their account page or into their prospecting or whatever it is that their area that they’re responsible to be working, that’s where that needs to be.
That’s what I demonstrated back in November, because that was one of the first things that the Salesforce and Tableau team got ready to go to market with, was that Salesforce action and being able to tag that and integrate it to embed work inside the regular flow of where someone is going to be day to day. The goal, of course, is to be able to have that conversational analytics happen. That’s what’s landed us into this. Really, the next focus of all the beta activity was around the semantic model and how to best inform it, because I’m speaking at the Tableau conference, and I renamed my conference session to something about your agent is only as smart as your semantic model.
Smart is not a word I would have used in a conference title, but I find it rather humorous because there’s a HR term for goal planning that revolves around the acronym of SMART, which is not very far off from the kind of thinking that you need to use when you’re putting really amazing data governance and rules and business best practices. The acronyms we use inside of either what’s historically been in a document or somebody’s mind about the domain, but now needs to move and transfer into electronic forms so that the agent can also access it and respond to folks, without requiring them to become data, people respond to them in the terminology, the language that they would normally use.
The desktop connection to that semantic model has been another thing that has gone to market now. Then there’s a collection of tools and features around auto-generation of, or at least tooling to help create that great governance inside a Tableau nexus environment, including doing the auto descriptions and then also even creating a model itself. In the fall, we had business rules, which was new and kind of novel, and hard to figure out what part of this belongs in a calculated field and what part of this belongs in a business rule. That was part of the new guidance that was published around Christmas time, was that distinction.
We also learned that metrics and calculated fields are things that the agentic elements, the generative elements in there, are able to read and then make the most of. That’s a real positive contribution to successful visual conversational analytics. Then Einstein has been released in many ways, and now it’s kind of characterized under a label called Datapro. What was and what we historically would have thought of as Einstein is that advanced AI feature in there that is able to help us with a lot of generation of syntax and take things that are written in natural language and translate it into requirements.
There’s a number of places where that’s present. It’s especially helpful in calculated fields because if you’re familiar with how to do calculated fields inside a Tableau desktop cloud, et cetera, the syntax is a little more technical. It’s more of a SQL issue. It’s a table dot name, a column name sort of thing. It’s a little bit more where there’s phrasing around it that is not quite as naturally flowing or user-friendly, if you will, in Tableau. We also had testing the model, but the testing the model there was pretty simple and pretty like straightforward and shallow. What they meant by that was as soon as you put a model together, it would give you an option to test.
That meant that on the page with your data model, you would have a chance to run a query or two to see if you were going to get the same kind of results theoretically that you had already pre-staged and tested before. I’m pretty sure that most folks I’ve bumped into who have come from any kind of data background that we’re entering into this space are going to come– Well, usually we arrive with having a rough idea of how many rows we’re expecting to see and what the relationships between things should be and what kind of results we’re expecting to see on the other side of it.
To do a functional query there, where you’re testing the things that have been chosen to do those relationships between tables, is pretty reasonable, but it’s right there under the heading of testing it. Initially, there’s been a constant stream, a slow-going stream of visualization improvements, but initially we had one suite of colors. From a Tableau point of view, that was kind of a surprise, but it’s been increasingly that the depth and the breadth is coming with time.
Then Concierge, that was the big talk and the big exciting new thing to natural language, ask these questions. Well, it rises and falls on the data model. We back up a step or two, and we really focus on the data model. Spring comes around. Whereas we only had places to put descriptions, even down into the sun of your be like your think of pulse metric, we’ve got metrics in Tableau Next that look almost like the same code base. I don’t know if that’s true or not, but it sure looks and feels very similar. In there, you get to spell out what the sentiment is. You get it to give a description, and all of that fuels that agentics element that’s inside this model.
With that, and the recognition of the time that that was going to require, they’ve a lot of spaces where Einstein will come alongside of you and provide the opportunity for you to give it the reins on creating those definitions. It does a good job, surprisingly so. Really good job. There are character limits, so there’s been a pleasure, too, where I have to go in after it and add a little bit more. I did notice in the beta that recently, if something is a primary foreign key, I didn’t see it giving any recognition on that. When I mentioned that to the development team, they said they were going to take them. That’s a good idea to get back to the team.
Anyway, I don’t know if that’s going to be added or not, but that’s one of the kind of things that I was like, “Shouldn’t that be included.” In any case, they’ve expanded the business rules in a couple of different ways where there’s more capacity. Initially, we had 20 rules we could add, but now we have more. There’s been just a stream of new visualization features, including things like new chart types, as well as a thing that’s almost like Show Me that will give us a recommendation on a chart and at least give you the what Show Me used to do of giving you, or still does, but it used to be all it did was it would give you a list at the bottom of the Show Me panel that says, if you have this kind of dimensions and measures, you can do this thing.
Now that’s starting to be present over in Next as well. We have more data types. Some of the ones I’m going to demonstrate to you guys is a dimensional hierarchy that I’m very happy they put in, because it really brings some things to life, especially on the visualizations, and then just in showing relationships and the drill-ins and the things like that you can do. Some of the coolest parts revolve around this last piece. For its ability to automatically generate a model, that’s really nice. I plan to show you that.
I did have it happen with the data that I have staged to do that with. We’ll see if it works. Last Thursday, it was demoing, and it didn’t quite work, but I’m counting on it working today. Then the AI optimization menu, with the maturity of Salesforce and their product line, they for a while have had some data validation, even a dashboard element that was taught on Trailhead and available for use inside Salesforce, generally speaking, that would, even with cool-looking gauges, would give you a level of information about the sufficiency of the data you had, down to how much of this column is empty.
You would identify what they were supposed to have in there, and then it would give you a breakout of the percent of saturation of each one of those elements. That sort of thinking has brought forward over here some of that AI optimization menu elements of how much is missing, what are recommendations of orphaned elements, like tables that didn’t have relationships. It will make suggestions on how to connect them. Then right now, one of the prescient issues is this thing of getting descriptions in there without it spending like a year to do. With the auto-drafting of a lot of that, it’s sped it up a lot. Then, on the optimization menu, we also have something that will show us what else is remaining to be defined.
I left a view of mine undefined so I could show it to you as well. The last thing that’s in beta right now that I personally have not had a lot of time to spend on it yet, though, is the calibration Q&A. That’s the idea that you put something into motion, you document it up, you’ve defined your relationships, and then you need to have that in practice, kind of like confirmation that the type of questions and answers that are happening with natural language are being correctly interpreted, where you’re reading those questions and responses.
Now I don’t know how many of you started early with ChatGPT. I’m just going to ask you on your Zoom window, if you started in the first year with ChatGPT, would you just give me a react? It’s around the bottom of the Zoom screen. There’s a little space that should give you a chance to react if you would just react on your window. Frank, I see you. You were early on. Anybody else jump in early with ChatGPT, maybe 2024 or something like that, or one of the other engines?
Okay, well, because I was teaching at a university and I figured that my students were going to be doing their best to let Chat do their work for them, I had no choice but to jump in as soon as possible and worked with a bunch of educators on what are we going to do, what’s our policy going to be, and how are we going to handle it, and there was a lot. Oh, Sandra, you were in in 2023. I’m just now seeing the chat. Well done. Okay, well, then you for sure saw what I’m thinking about here were two things.
One is it was constantly asking us for confirmation, and the authors of them wanted us to write those answers and give feedback, almost in a way that it was somewhere between humorous and just made me distrust it all the more because it needed to be, but they were trained in all the models. The other side of it was, as an academician, I needed something I could do in front of the students that would be just incredibly wrong. Until the spring of ’25, the beginning of that year, I could go before my class and say, “Okay, we’re all going to use AI. We’re going to lean in. We’re going to use it for research, and oh, and by the way, how many R’s are in strawberry?”
Well, it would very consistently, even though I’m saying the same question to it in every class I have, it would tell everybody two. Well, clearly there’s three, and something about the double R’s and the way it was tokenizing the word, just it would miss it. Having something that clearly wrong about the engine as recent as it was, probably January of ’25, where I stopped being able to use that as a clear indication of a problem we were having there.
Anyway, but all that aside, this is we’re at the early days of this, and so there’s a lot of growth that’s going to happen, and one of the key objectives besides accuracy and integrity and the trust layer and all the words you’ll hear from Salesforce is interoperability, and so I have heard that in so many ways from them and the messaging that they’re sharing and showing in the essay that I’ve worked closely with on Next, and their goal is to maintain all these platforms and to have them be kind of not necessarily choose your own adventure, but find your space that is comfortable for you to live in and then be able to move resources amongst these environments.
The stated thing is there will be a space at the table where Tableau and Classic or Desktop, however you want to call it, will always exist, and then one of the things I’ll show you today is how you can connect from Tableau Desktop into the semantic model that you might find on Next. This is from the fall, and this is a Salesforce account page, and this is one of the examples of what we would do when we would maybe create– This is a sentiment analysis dataset that was brought in to go alongside the opportunity tables for Salesforce, and then I created a dashboard and then tucked it into a new tab because by default on the account pages you have related in detail, but you don’t have analytics.
That was something that was pretty straightforward to do, and I also was able to do it in a way where I just tucked it in. It’s not that hard, actually. That is an example of one of the things that they consider to be a priority here. This is a link that’s to remind me that I have this video for you to share with you guys. Hold on one second. Let me pull that link out of this deck and put it into chat, and then I’ll resume my share. Hold on one second here. I wanted to share that video with you so that you had it if you wanted to review that after a while. One second, please. Get that back over here. There we go.
It’s about six and a half minutes long, so rather than take up your time today here in this environment, I thought I would just share it, and there it goes into Zoom chat. Okay? Let’s move on to some of the new parts. There we go. I’ll find my Zoom screen and reshare. All right. That is available for you if you’d like to take a look at it. All right, so some of the main key parts of today are going to be about– and here’s an example here on the right-hand side.
This is a slide that I recently encountered with the Salesforce presentation of what calibration is going to look like, kind of the question, embedding of the questions, and it being rated as successful or not. This is what our data model, the actual modeling environment, looks like. It’s like an agent, it’s like an intern, and they need to be brought up to speed on your terminology and the way you do business, the acronyms we use, that sort of thing is going to be– that is the right thing to be considering when you’re thinking about what it is that we are trying to do in terms of informing the model, because we’re technically, as they like to call it, grounding the agents, because it doesn’t know our lingo, our business rules, and these instructions need to be put in to empower Concierge.
This deck will be shared with you as well on Friday if you want to see it, but this is their overarching structure of how to build this trusted scenario so that Tableau can still provide you with really great answers and have it be accurate as well as approachable. This is what our business rules looks like, and this is something I shared a little bit about or more about in November, and we’ll circle back around in the summer on this one, but this is just where we’re going to put in mostly around terminology, and like last Thursday when I was presenting about this, one of the things that we did was I asked, and we were in Austin, and we were on site at Salesforce, and I asked what their least favorite road in Austin was, and pretty much it was a room of 50 or 60 people.
Most everyone said our Interstate 35 because it’s just a hot mess. We’ve outstripped our infrastructure. It was wonderful because I did one of these little Mentimeter word cloud things, and on screen you could just see how many different ways I-35 had been written, spelled out with lowercase I and then 35 and just 35 and then I-35. That all by itself just shared and showed the fact that we all knew what we were saying in terms of the intent, but the literal references were very distinct and unique. If I’m thinking about an agentic element in my environment that’s going to be responding to people’s natural language questions, normalizing or sharing what those iterations.
Now, I’m not talking about literally necessary that whole thing because even Tableau prep can do the fuzzy logic to figure out those things where the letters are similar, but more profoundly, where we have specific acronyms. I have, in every class I work with, people’s, their internal data, and as an outsider, let me just tell you, you guys all refer to things very distinctly and very much different. Even it may be incoming revenue or incoming money flows, there are so many words that folks use to describe the same thing.
That’s the kind of language that needs to go into a business rule to make it clear, so there’s less guessing or less misses that the agent will have in terms of just trying to get it done quickly. This limit right here has been updated as of about February timeframe. They’ve gotten more space in there for that. Now, one of the questions is what goes in a business rule, and what do you actually need to do a calculated field over? Well, this is a little bit of a guidance that I’ve been refining as I see more come out from them about what belongs in which one.
When my testing, I started very disciplined in a systematic approach on what I was doing in terms of the questions I was asking and the progressive build of additional features I was feeding into the Tableau Next model in terms of additional business rules or additional calculated fields or metrics, and I’ve got to tell you, I found a large impact from the calculated fields and metrics. Having those defined and that clarified, especially when I was thinking of things that were almost going after, like net sales or those things where you had to reduce any returns or pull certain pieces out, that was something that the metrics were really making an impact on.
Auto SDM and calculations for SDM, the semantic data model. This is what the old screen used to look like of readiness. I’m going to show you the new one. A lot of the interface has changed a little bit. Testing the semantic model, this is indeed what this still looks like. This is the classic Superstore data set. As soon as you get a data model together, it’s going to ask you if you want to test it. This is the boxes it will give you in the pane right below your model to be able to write a few queries.
It’s going to be asking you for the dimension and the measure, and then it will give you the returns on the right-hand side so that you’re being able to test straight away at kind of a high level, did your connections between the tables work? I think that’s what it’s mostly built for. Then the generation of the semantic field, the fields has been fantastic. We will see this, and this is now a little bit more robust and is going to highlight any missing descriptions, and then give you a chance in a consolidated window to address them, so you don’t have to go chasing everyone down through the data pane because we do have a standard data pane there.
Any place you have this banner on the right-hand side of a dialog box, you’re able to use Einstein to help in a generation. Now, before I go any further, let me also mention there’s been a lot of discussion this last year about metered and unmetered use of Einstein, and my understanding is that initially it was totally unmetered, and then it went to kind of a full metering, and then over the winter they have reduced it for, my understanding is if you’re using it within a configuration and setup and generating the right kind of things on the background, that that is unmetered entirely.
That should help a lot of us use them and use it well. If you’re in the data pane itself, this is more like what you might encounter, having that description box there with the chance to use it to bring forward. This was a slide from earlier. This is in general availability now. It just happened at the beginning of the, somewhere like February time frame. Last year’s testing center, this is one of the last pieces that’s in testing right now, and it’s been through a couple of facelifts on exactly how it’s going to work on classifying and rating responses.
The testing center has got this environment where you have the questions, you have calibration tools that are in play, and then you end up with an accuracy score, and this is the part that I have not had a chance to really dig into deeply yet. That will be an update I can provide for you guys in June. Before I dive into my demo, I wanted to mention that if you want to take note of this particular link here, there is a pretty sensitive Trailhead environment up. In fact, let me just pause my screen for a minute and get the other link that I have prepared for you.
I put together a Google Doc to share, and it is right here. Let me now share it with you. This is a lot of things that I have collected that I think are helpful for being able to dive in, so you get a taste test without having to spend a lot of time in a beta environment. This is the Trailhead six-module conceptual overview, and it has some embedded video demos. Then this was recommended by some of the internal training team, one of the senior guys I really respect, some basics on LLMs and agents, the Tableau agent in general. All those are documents.
Then I highlighted some of the Trailhead pieces that were quick looks. All of these are like five-ish minutes, so they’re very fast, and they are newer, so most of them are a little gamified. There’s a little question at the end, so that sort of thing. You can earn a badge. In any case, I have this to share with you as well today, so that hopefully that can help you navigate through to a little faster absorption of what is the opportunity here and not have to spend quite as much time on it.
I’m going to put this into chat as well. That should be shared with everyone where you can view it and share. I have the tiny URL on the next slide. Anyway, okay, so let’s jump over to Tableau Next. I’m going to pause my screen and bring that up. Oh, and that was a QR code. See, I was thinking clearly about this. I just didn’t get here in this moment with it. Okay, so there’s the tiny URL for that page, and then also, if you want to use your phone to just quickly get that, that QR code will also take you to the page, the resource page, okay? A few ways to get there.
Let me pause the screen and hop over to my Salesforce login, and when we log into Tableau Cloud, we are going to be headed in there, not through a native– I’m not launching Tableau screen individually. I’m going in through Data Cloud or Salesforce, your opportunity page, or something like that. You’ll come to Tableau Next here, and there, as you might expect, there’s an assortment of permissions and all of that that has to be set up. You see it knows me. Meaningful. No, I’m just kidding.
All right, so with this, I have some things in here that I have already prepared, and just this particular page has gone through quite a bit of a rework to make it more engaging, I would imagine, is the right words for that. There’s a system of organization here that’s in play with Tableau Next that is much in the same way that I’m assuming most of you are recognizing a fair amount of your names, that you guys are Tableau users. We have data sources, and then we have the working spaces of worksheets and dashboards and story points.
Well, on a very correlated basis, there is similar phrasing for these working spaces, so we have a workspace that would be where assets from a certain genre or data story would belong. Then, along that, I have the dashboards. I have the visualizations, the semantic model, and my data objects. Now, this interface, significant change in the Q1 of this year. It didn’t used to look like this, where we had these cool thumbnails. Now, interestingly enough, if I click on the purple link, it’s going to take me into it, and we’re still offering introductory videos.
In any case, if I click on the thumbnail itself, it’s just going to give me a preview, which is an accurate preview, but it’s not a click-through preview. In any case, either way, it will get us there. I started with these four tables that were from an HR data scenario, and you’re going to be able to add them in these drop-downs, pretty straightforward. You can also pull them over from Data Cloud, so anything that’s coming out of Salesforce, all the Salesforce objects, those are going to be– Generally speaking, I’ve observed that the things that come from Salesforce are generally listed as DMOs, data model objects, and the things that I upload from file come in as data lake objects, so DLOs and DMOs.
They’re borrowing some of the bigger data vocabulary, and we are most certainly kind of migrating into a bigger environment. If I was going to add some of these things in here, I could do that here and then add it to my environment. When I started this, I did do that just like that. I put those four tables in, and then I asked it to make the model. Let me show you what it did, and then the reason that it’s kind of like, from my point of view, it was novel, is because I had cleaned up these Excel tables, so they weren’t hard for it to do, but the fact that it did it without any asking questions was awesome. It just didn’t ask for validation.
The more significant thing was it actually added a couple of things for me here. It added a metric, so the blue icon is one for a metric, and this is a Boolean flag is what it’s doing here. Actually, it’s a calculated fill, and the green is my metric. It added employee tenure in days with a date diff calculation, and then this one of is null to see if the employee was active. That was something I didn’t ask it to do other than the fact that I said that this was an HR, human resource data set, and I wanted it to orient the analysis around the employee.
Honestly, I was kind of guessing at what to tell it, and then it did this, and it gave me a couple of extra fields that I didn’t have to then generate. This is very similar to our data pane, which has been like an old, familiar friend. One of the newer things that was released this first quarter is a dimension hierarchy, and while that may sound like “but of course,” it’s not “but of course,” because this is a full rewrite of this application. To have a dimension hierarchy was something that was identified in the fall and then implemented pretty quickly, and they are on a weekly cadence of new things.
Back to my initial environment, I wanted to also show and share some of this. These are my visualizations. My mission here was literally just about exploring the visualization types because they have expanded. Initially, we had three, and now we have quite a few more, and, in fact, we have a Show Me meets Suggest tab over here where I can have it do other things. With my dimension hierarchy, I’m able to do what we would take for granted inside of Tableau. This was new and novel here. This is, I think, initially created more along the lines– The way I saw it demoed initially was somebody using the opportunity tables to set that in the stages, and then they flipped it, they rotated it.
You can rotate the rows and columns here much the same way we can in Tableau, and then they had the opportunity things set into this funnel, whereas I’m using it differently because I can. Then, moving on to these other things, you have a natural donut here. You don’t have to do min zero or map layers. It’s just naturally occurring. I put together a dashboard that is meant to be more like a preview of various ones, and let’s see why. I’m having to do some reloading today, but it is working. There we go. All right. A heat map is also one of the newer things, again, with the dimension hierarchy that makes it so much more engaging, I feel, when you can drill into things.
I have not tried to apply a parameter to make it so it drills into just a section, but that will be one of my next things that I get into. It’s starting to look a lot more like what we all take for granted. The image, being able to place an image on a dashboard, was also a new key one. The end point on a lot of this, of course, is to get to where Concierge is giving us help. When you have come from a Salesforce side, they’ve had Agent Force for quite a while. The Agent Force for analytics is the Concierge agent. That’s what we’re all waiting for.
Then, to be able to ask and answer questions really isn’t the point of what I wanted to share and show today. I will show you this, and I’m going to back up and go back to the semantic model. I have four tables. Also, the HR tables, I have them double and a little bit different names. We’re going to try to have it do the auto-generation of the model. Also, I’ll show you where to get into doing that, the labeling where it’s going to give you some assistance.
This table is a lot about tenure. If I was to ask, let’s see, then I have three different just as you can tell, I have three different organizations. Some looks like a high density of full-time employees. This is talking about most of these things are all anchored around the occupation rate is what it’s called in terms of the type of work week that they’re assigned. Then we have a lot that was focused around tenure. What if I say what is the organization with the highest tenure? Let’s see, I should start with that and see if it works on that, and then if it’s successful, I’m going to ask more questions.
Because when I was testing, I always would ask a simple question. Then I would ask something that would represent something like a group by. Then I ended up asking the next question, where I would be in a more compound question. That may be what’s called in the LLM circles of an anti-statement, so more of that exclude include kind of thinking. When you get a question that is working over here with the agent, it’ll often say it’s thinking or analyzing your data. That’s a good sign. I learned that. Then also it’ll usually give you a dialogue about the response. Then I give you a little baby chart.
It normally, I think always now, will give you a little bit of sources and explain what its methodology was to get to that. In short order, we’ll find the edges of where this is. What I found when I bumped into stuff it didn’t understand, it would ask for clarity about specific things, or it would give me recommendations on how to build that chart myself. The recommendations for clarity actually were pretty good on the last time. I was doing this testing on the bot. If anybody wants to suggest a question in chat, I can circle back around and do this, assuming we have a little bit of time at the end.
Let me go back to the other environment so that I can show you the one I had staged for us to see the– So my human resource space right here. I did not build the model in yet, so we’ll see that first. You can see I loaded my four Excel tables here. I want to add a semantic model. I want to do it. You have choices to add to an existing, create something new, extend a model, use a published data source, or from a data kit. I want to use it from data objects. These are my four that I want to use. They’re literally, as you can tell, copies of the ones I had in the other space.
Now, this is where you’re going to engage more of the AI element here or build with Datapro. I’ve got it selected, and I’m going to give it a little bit of description. This has the capacity to build some of those business-critical KPIs, just depending on what the words are used in this space. I’m going to ask it to build a semantic model based on the human resource. I guess I don’t need to type and talk. Hold on one second.
>> [PAUSE 00:41:59]
I’m going to just let that go with that. That’s probably enough. Then I’ll tell it to create. Then we wait for just a second. There it comes. At least I want us to [unintelligible 00:42:45]. Created a model. Okay, so it’s not doing the– New suggestions are available for me. Let’s see what the suggestions are. We have suggested relationships, and there we go. That’s so interesting because when I did it initially, you saw the model it builds. Now here we are with it suggesting relationships. Let’s see. Some review and I’m going to apply.
Those are going to be correct because I named them incredibly straightforward, so we can review it, and then it’s going to bring us into this pane below. It’s wanting to know if we need to match these, and they are matched. Let me see if I can get this wider. There we go. This is department ID and department ID. Clicking on this box produces a pop out that would give us the full breadth of all this there. You could cancel, reject. I guess in a way it’s kind of good. It didn’t just auto do it. Although I thought that was pretty slick when that worked for me.
Let’s review this. Then you can see here the full span of the labeling. That is correct. I do want it to be equal to the cardinality. This is also something that would be good to update. This one is going to be a matching the fields between the position and the employee. I think they did have some elements in here where it was more of a many-to-many. Let me back up and see if I might need to correct some of those others. Let’s see. You can only have one at a time. How about that?
You could have one on the employee side and many over here. I’m kind of having that Tableau Cloud moment where many-to-many seems to be an answer to a lot of things. I think I’ll just do that like that. All right. That’ll be interesting to see how that responds. Then, to be able to test the model, it would also be in line. Let’s see. We have it belong to one organization at a time. The table on our left is a primary. Well, we’ll see. In any case, the key part that I really wanted to show you is under this element. The testing part that I mentioned before and also showed you in November is here.
AI optimization. If you click on optimize model, it’s going to basically go through a fair amount of– it’s going to give you a header on this. Then also here’s your manager business preferences, a page that basically is like a checklist for agentic readiness. They verify questions is from that calibration. The part here that is really nice is if we had individual tables that were away, it would suggest missing relationships. You don’t have any. They’re isolated in the missing descriptions. This is where we’re going to have a lot of elements, because in addition to the few fields I had in there to make this be ready for a larger environment, then it’s added quite a few of others.
Then, for department ID, I could very easily type my own here. It also can do a really good job of providing an update here. Then we’ve got this as well. I can save them, and then they’re done. Now, let’s go back to the one that was my other one, because I left just a few or that, and the rest of them are done. Go back to the semantic model. AI optimization. Go ahead and select that. Whatever ones are left over that you’ve not done, you can see that there’s a couple here that I left in employee. Same. Just a couple. Some of the unusual ones that were added because of the bigger environment and what they’re adding on there. I can save those.
Then the next time I come in here, it won’t be asking me for these specific ones because they’re done. One more thing that I wanted to demo before we run out of time is how I can approach this from a Tableau Desktop point of view. Let’s bring that up, because now that my semantic model is defined over here, it is available for me to pull from Tableau Desktop. It’s on the way. This is surprisingly straightforward. I can connect, and you’ll see what I’ve recently connected to. Tableau semantics is the first. Whatever address you use to go into the Salesforce environment, this is my beta environment there, doesn’t have to match your IDs in your desktop.
It’s going to validate me as having access and make sure that I’m allowing access. It’s going to say okay, to this. In the background, you’ll see that it’s offering me–This dialogue reminds me very much of what happens in cloud. It’s offering me the the name of the various semantic models that are in my environment. Notice this description that I initially gave, and even noting that it was auto SDM. It was generated by the system itself. Then here’s the user intent for it that I had expressed. That’s the one I want to connect to. This is going to take it a second and pull it all in.
Makes that investment you make on the cloud of conditioning all the definitions and things more worth it, I believe, because of that preserving it. Now, it’s not bringing all those definitions local to me here, but it is maintaining that unified central resource. They very much have emphasized the idea of zero copy to try to minimize the cost of consumption on the data cloud side of the house. That’s another thought in terms of having one repository that is the main source of truth, if you will, that uses words lightly or carefully would be more the words for that. Just wanted to encourage you with that ease of access to bring it back home to do more with it.
Anybody have a question they want to ask in general, or a question they want me to try on the agent? I’m happy to just give that a shot in the last minutes we have here. Frank, do you have a question?
>> FRANK: Yes, Celia. Thanks for teaching us today. Really appreciate it. I was wondering about the Data 360 relationship, like if you put your semantic model there and the dependency. Can you can you speak a little bit to that?
>> CELIA: The data stream area is not my area of expertise, but I did have to load some things there and have had to– My understanding is Data 360 is where everything is being held for Tableau Next. It’s not got a separated environment. It is using Data 360. As we look at the data lake objects, for example, over in data cloud, you can see my little baby tables I’ve pulled in here. I think that they have rebranded it this last year for data cloud and 360. Those words are coming together as this one unified thing. Is that what you’re asking about there?
>> FRANK: Yes, that’s great. Thank you.
>> CELIA: That should smooth the path on accessing Salesforce data as well to get those environments a little more unified on point.
>> FRANK: Yes, because if you wanted to use agent force against some of these data points, you could do that as well.
>> CELIA: That sounds reasonable.
>> FRANK: Then you have the agent force for analytics within Tableau Next, which looks really interesting.
>> CELIA: Because a lot of potential. Like I said, I have been so focused on the data model side and the construction, and whether or not all those little parts and pieces are going to work well, that my attention is going to swing back toward Concierge and Q&A, that’s possible there. Also, the calibration feature, I need some complex data to actually give that its full mark or full paces is what I’m thinking. I’m tempted to call it a data lake. It seems a little bit like, “Seriously, is that where we’re at now?” Maybe it is. Anything else, y’all? David, what do you mean the data models are different models are different.
>> DAVID: Just that it appeared that the suggested data models from your semantic model that you had built prior to this presentation, and the one that you attempted to build during the presentation, it appeared that they were different, that it suggested something different. Do you find that to be the case? If you give it the same prompt, sometimes you get one suggested model, sometimes you get a different suggested model?
>> CELIA: I’ve been teaching a lot of SQL lately, so my best guess is I probably went through here and adjusted cardinality. I don’t see that I did now, or didn’t save it. Well, my gut response is gosh, I hope not. Right, David?
>> DAVID: [laughs] I would hope not to.
>> CELIA: That is going to be a good point to test because– Yes, you hope not. I really don’t prefer the default of many-to-many, which kind of seems the new normal. I’m still mentally kind of wrestling with that. I have some colleagues who are visionaries who’ve been trying to convince me that that’s okay. I just feel like that’s a risk. Anyway. That’s a that’s. Good question. I’ll be paying closer attention to that, so maybe I have more thoughts on that in January. June. Sorry.
>> DAVID: Thank you.
>> CELIA: Yes. You bet. All right, team. Well, thank you, guys, for being here today. I really appreciate it. Just like a really slow birth of this new thing that probably has a– I mean, it seems to have a lot of potential. They’re working diligently, and just about twice a month, there’s new features that are being released. Then, alongside the major releases for Tableau Desktop, you’ll see a collection of Tableau Next updates as well. Stay tuned for it’s just about to get really exciting, I think.
All right. Well, thank you so much. Hope to see you next month. Lauren, do you remember what we’re doing next month? I’m sorry. At this moment, I can’t. We’re doing a rewind next month, I think, for Tableau conference. You and I are both going to be there. She’s speaking with one of our clients. I’ve got more to talk about on this that I’ve got to dig into deeply. There you go. Oh, thanks very much, David. All right, team. You guys be well and well. Hopefully we’ll see you soon. Okay. Thank you so much. Thanks for being here. Thanks, everybody.
>> [00:55:26] [END OF AUDIO]
Links Mentioned
- Tableau Next Shared Resources (Trailhead & Docs for Conceptual Overviews and Short Demos)
- Tableau Next Dashboard Integration with Salesforce Account Management Demo
- Tableau Next Slide Deck
Presentation Summary
In this Data Driven Community webinar, we shared a practical, experience-driven look at how organizations can prepare their semantic model for the next evolution of analytics in Tableau Next. Drawing from nearly a year of hands-on work in the beta program, the session centers on a core idea: successful analytics now depend on building meaning into the data model before creating insights.
We explored the semantic data model as the foundation for conversational analytics, showing how defining relationships, metrics, business rules, and domain language within the semantic layer enables tools like Concierge to deliver accurate, context-aware insights.
We also demonstrated key Tableau Next capabilities, including auto-generated semantic models, AI-generated descriptions and calculations, business rule expansion, and AI optimization. These features accelerate development while surfacing gaps in relationships, definitions, and data quality.
The session emphasizes the importance of testing and calibration, highlighting how teams can refine models and improve how natural language queries are interpreted over time. While AI supports scale, domain expertise and intentional design remain essential for accuracy and trust.
Tableau Next is evolving analytics workflows by embedding governance into the semantic layer and supporting interoperability, enabling semantic models to be accessed across tools like Tableau Desktop. Organizations that invest in structuring their data with meaning will be best positioned to take full advantage of AI-enabled analytics.
Session Outline
- The Shift To Semantic-First Analytics
- From Dashboards To Embedded Analytics Workflows
- Building A Semantic Model That Works
- Why Business Rules Matter More Than You Think
- Accelerating Model Development With AI
- AI Optimization And Model Readiness
- Testing, Calibration, And Trust
- Connecting Tableau Desktop To The Semantic Layer
- The Future Of Analytics Starts With Meaning
The Shift To Semantic-First Analytics
When first working with Tableau Next, one principle quickly stands out: everything depends on the semantic data model.
Rather than focusing on building dashboards or calculations first, Tableau Next emphasizes structuring data in a way that reflects real business meaning. This includes defining relationships, clarifying terminology, and embedding business logic directly into the data layer.
This shift is critical because the goal of Tableau Next is to enable conversational analytics, where users can ask questions in natural language and receive accurate, context-aware answers. For that to work, the system must understand not just the data, but the intent behind it.
The effectiveness of these AI-driven experiences will “rise and fall on that semantic data model.”
From Dashboards To Embedded Analytics Workflows
One of the earliest use cases explored in Tableau Next was embedding analytics directly into existing workflows, specifically within Salesforce.
Instead of requiring users to leave their workflow to analyze data, Tableau Next allows dashboards and insights to be integrated directly into environments like account pages or prospecting tools.
This approach reduces friction and ensures that insights are delivered exactly where decisions are being made. It also sets the stage for conversational analytics, where users can interact with data in context rather than navigating separate reporting tools.
Building A Semantic Model That Actually Works
At the core of Tableau Next is the semantic data model, which acts as the foundation for all analytics and AI interactions.
This model can be described as something similar to onboarding a new team member. It needs to be trained on your organization’s terminology, business rules, and expectations.
This includes defining relationships between tables, creating calculated fields and metrics, documenting business logic and terminology, and providing clear descriptions for fields and measures.
One key insight from the session was that calculated fields and metrics have a particularly strong impact on agentic analytics. When these are clearly defined, Concierge can generate more accurate responses and meaningful visualizations.
Why Business Rules Matter More Than You Think
A major component of the semantic layer is business rules, which help define and standardize how terms and concepts are interpreted.
A simple but clear example: even something as straightforward as a highway name can be written in multiple ways (35, I-35, i35, Interstate 35).
While humans can easily understand these inferences and variations, AI business systems need guidance. Business rules allow you to normalize these differences and ensure consistent interpretation across queries.
This becomes even more important in enterprise environments, where different teams may use different terminology to describe the same concept. Capturing these variations in the semantic model reduces ambiguity and improves the accuracy of AI-generated insights.
Accelerating Model Development With AI
One of the most impactful advancements in Tableau Next is the use of AI to assist in building and refining the semantic model.
Through tools like Einstein (now part of the broader Data Pro experience), users can automatically generate field descriptions, metrics descriptions, calculated field formulas, recommend table relationships and potentially create entire semantic models.
In the webinar, we demonstrated how the system can create a model from a set of example human resource data tables, automatically suggesting relationships and even generating useful fields like employee tenure or activity flags. While these features significantly speed up development, they still require human oversight. The goal is not to replace domain expertise, but to augment and accelerate it.
AI Optimization And Model Readiness
To support this process, Tableau Next includes an AI optimization layer that evaluates how well your model is prepared for conversational analytics.
This includes checks for missing relationships between tables, incomplete field descriptions, data quality issues such as empty fields, and opportunities to improve model structure.
The platform also provides a centralized interface for filling in missing definitions, reducing the need to manually search through the data model.
This “readiness checklist” helps ensure that your model is properly configured before it is used for visual insight or agentic queries.
Testing, Calibration, And Trust
Another key theme in the session is the importance of testing and validation.
Tableau Next includes tools for validating the semantic model by running queries and comparing results to expected outputs.
Beyond basic testing, a newer feature, Calibration, focuses on evaluating how well the system interprets natural language questions. This involves reviewing questions, assessing accuracy, and refining the model to improve performance over time.
This process is essential for building trust in AI-generated insights, especially as organizations begin to rely more heavily on conversational analytics.
Connecting Tableau Desktop To The Semantic Layer
Despite the focus on Tableau Next, traditional tools still play an important role.
In the webinar, you see how users can connect Tableau Desktop directly to a semantic model built in Tableau Next. This allows teams to maintain a centralized source of truth while continuing to build dashboards and analyses in familiar environments.
This “zero-copy” approach ensures consistency across platforms and reduces duplication, while still enabling flexibility in how data is explored and visualized.
The Future Of Analytics Starts With Meaning
The tools are evolving quickly, but the principle remains the same: without clear definitions, business context, and well-structured logic, even the most advanced analytics will fall short.
Meaning comes first. Everything else builds from there.