As we venture into 2024, the need for robust data visualization tools has never been more critical. This is where Tableau becomes a game-changer in data analytics and visualization. Migrating to Tableau is not just a step toward better data handling; it’s a leap toward transformative business insights and decision-making.
With its intuitive interface and powerful analytics capabilities, Tableau has been revolutionizing how companies interact with their data. From small startups to global conglomerates, the stories of transformation are as varied as they are inspiring.
In this blog post, we bring you Tableau case studies to inspire you in 2024. Each case study is a testament to the versatility and impact of Tableau, showcasing how different organizations have harnessed this tool to drive growth, efficiency, and innovation. Whether you are considering migrating to Tableau or looking to maximize its potential, these stories will provide valuable insights and actionable lessons.
Tableau Case Study 1: Bentley Motors – Revolutionizing Luxury Automotive with Tableau

Bentley Motors, a paragon of luxury automotive excellence, recognized the imperative for a digital transformation to stay ahead in a rapidly evolving industry. Embracing Tableau self-service analytics marked a pivotal shift in their approach, leading to transformational changes aligned with their future-focused Bentley100 strategy. This strategy, targeting an all-electric vehicle portfolio by 2030, required a data-driven backbone to meet the challenges of an industry in flux.
Tableau’s impact is evident in various facets of Bentley’s operations. In manufacturing, Tableau’s drillable dashboards have revolutionized process management, enabling quick identification and resolution of issues, leading to more efficient production lines. Similarly, in the realm of customer experience, Bentley leverages Tableau to amalgamate and visualize customer data, enhancing personalized customer journeys and interactions. This unified data approach ensures each Bentley customer feels uniquely understood and valued.
Tableau Case Study 2: Trajektory – Revolutionizing Sports Data Analytics with Tableau

Trajektory, a Chicago-based sports data startup, embarked on a journey to redefine how sports organizations manage and leverage their data. Specializing in aggregating diverse data sources into a singular portal, Trajektory faced the challenge of effectively visualizing this data to value sponsorship assets accurately and in real-time. Their goal was to provide sports teams with the tools to create comprehensive, insightful reports for sponsors, vendors, and partners, but they lacked the necessary infrastructure to integrate their data with Tableau’s powerful visualization software.
A significant milestone in this partnership was the development of a custom-built portal, integrating Tableau for front-end data visualizations. This integration was pivotal in enabling Trajektory to build and refine their own dashboards, enhancing the final presentations for their clients. The portal provided a secure, single-point access for clients to view all their data, a crucial feature for data-driven decision-making in sports organizations.
Tableau Case Study 3: Verizon – Enhancing Customer Experience with Tableau
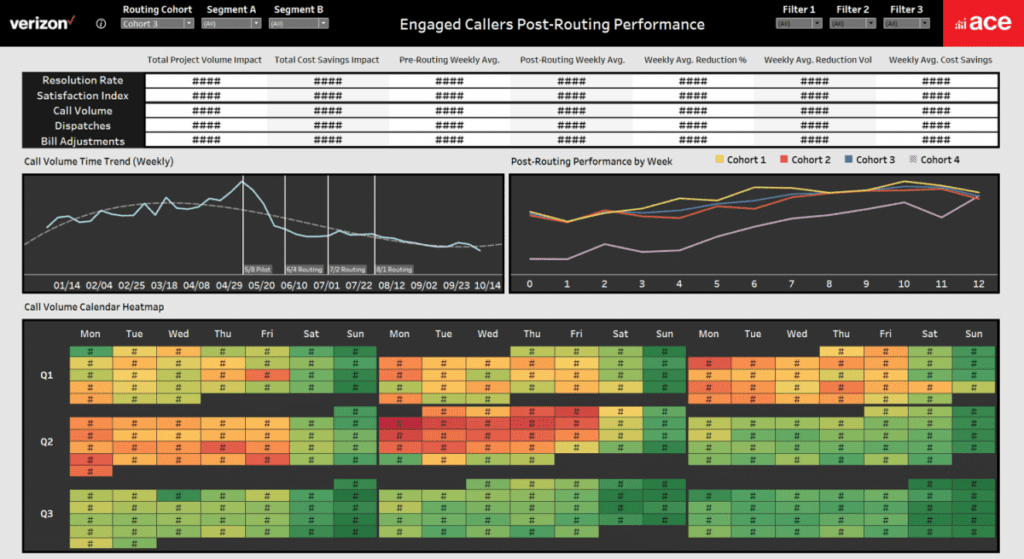
Verizon, a leader in providing broadband Internet, TV, and landline services, embarked on a significant endeavor to enhance customer experience using Tableau. Faced with the challenge of managing vast amounts of data generated daily, Verizon’s Analytics Center of Excellence (ACE) team aimed to optimize operations across various functions like call centers, digital platforms, and dispatch services.
By integrating data from diverse sources like Hadoop, Teradata, and Oracle, Verizon’s ACE team developed over 1,500 Tableau dashboards. These dashboards were essential in ingesting billions of rows of data, thereby reducing customer service analysis time by 50% across multiple teams. This effort led to a remarkable 43% reduction in call volume and a 62% decrease in technical dispatches for certain customer cohorts, significantly enhancing the efficiency of their operations.
Tableau Case Study 4: Empower Physical Therapy – Streamlining Operations with Tableau

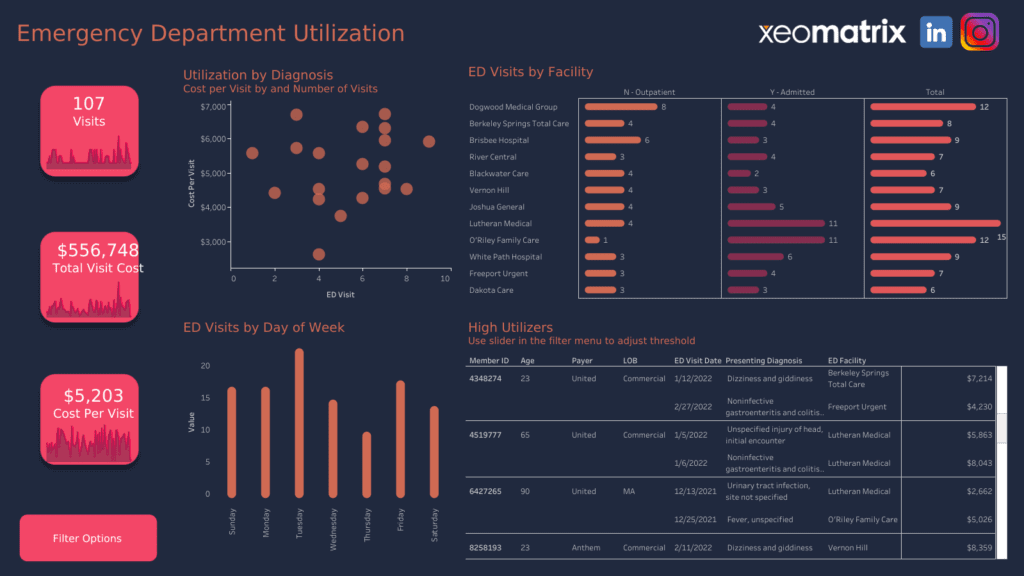
Empower Physical Therapy, a rapidly expanding therapist-led company with 40 locations across the United States, faced a significant challenge in managing and presenting their financial data. Their growth demanded a sophisticated solution for sourcing, integrating, and reporting financial data, particularly given the need to handle sensitive patient information in compliance with HIPAA regulations.
Key takeaways from this case study include the development of HIPAA-compliant Tableau dashboards, the delivery of actionable reports that streamlined office processes, and the successful integration of multi-platform technologies to create reports that underscored the company’s value to its investors.
Read the full case study on how Empower Physical Therapy streamlined its operations with Tableau.
Tableau Case Study 5: Mercado Libre – Fostering a Data-Driven Culture with Tableau
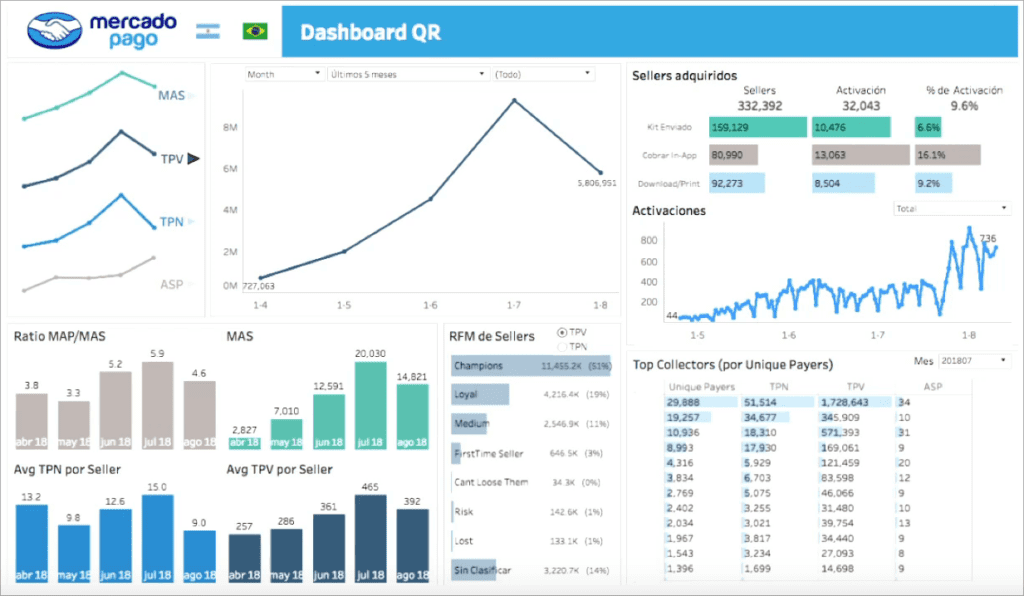
Mercado Libre, Latin America’s leading online retailer, embarked on a transformative journey to establish a data-driven culture across its rapidly growing organization. With over 30,000 employees and operations in multiple countries, the company faced the challenge of upskilling its workforce to harness the power of data effectively.
The solution involved a comprehensive approach to data culture, integrating technology, data collection methods, and cultural changes. A key component was the implementation of Tableau, which saw a 5x increase in adoption with 12,000 active users, 9.4K data sources, and 9.5K workbooks. This significant shift in data analytics capability was instrumental in redefining Mercado Libre’s business processes and enhancing the quality of employees’ working lives.
Tableau Case Study 6: Splunk – Enhancing Efficiency and Performance with Tableau Cloud

Splunk, a San Francisco-based leader in data-to-everything platforms, embarked on a strategic migration to Tableau Cloud, driving significant efficiency and dashboard performance improvements. This shift was part of Splunk’s commitment to reducing server administrative burdens and embracing a cloud-first approach, in line with their SaaS-based business model.
The migration to Tableau Cloud was a pivotal decision for Splunk, aiming to alleviate the increasing strain on server capacity and performance due to rapid growth in Tableau adoption. The transition streamlined their data visualization workflows and aligned with their software-as-a-service ethos, reducing the need for dedicated IT operations and data engineering management for the platform.
Tableau Case Study 7: NYU Langone Health – Advancing Healthcare with a Data-Driven Culture Featuring Tableau
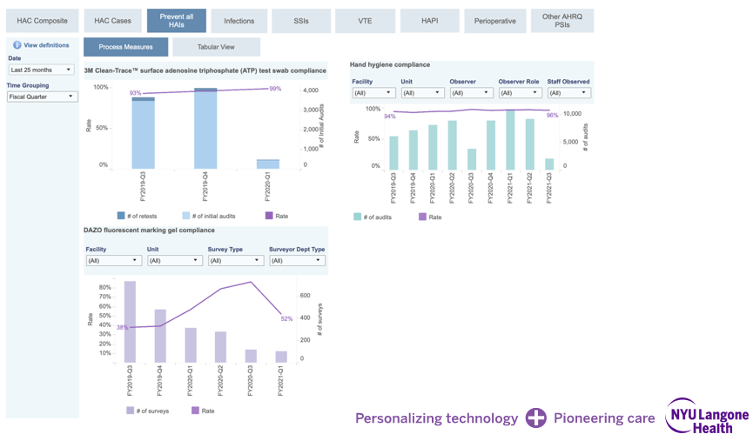
NYU Langone Health, a top-ranked U.S. hospital, has successfully built a data-driven culture, leveraging Tableau visual analytics to enhance healthcare quality and efficiency. This transformation has been instrumental in improving their national medical school ranking and boosting their NIH research funding portfolio.
By leveraging Tableau visual analytics, the institution has improved its operational efficiency and financial management and elevated the quality of patient care.
Tableau Case Study 8: Cervey – Enhancing Healthcare Technology Solutions with Tableau

Cervey, a provider of technology solutions for pharmacies, Pharmacy Benefit Managers (PBMs), and Long Term Care facilities, faced a significant challenge in deploying Tableau dashboards to their clients. The primary concerns were ensuring HIPAA compliance for sensitive patient data security and developing visually appealing dashboards for enterprise-level customers.
The Tableau dashboards effectively integrated and streamlined daily operational processes, facilitating quick and secure access to essential data for pharmacy transactions and clinical workflows. This enhancement in their software solutions significantly elevated Cervey’s value proposition to their existing customer base and bolstered their attractiveness to potential new clients.
Read the full case study on how Cervey enhanced its healthcare technology solutions with Tableau.
Tableau Case Study 9: Carter’s Inc. – Fostering Data Literacy for Retail Excellence

Carter’s Inc., a leading children’s apparel company based in Atlanta, Georgia, embarked on a significant journey toward digital transformation and data literacy. Facing the immense challenge of managing 50 terabytes of enterprise data and shipping approximately 700 million units annually, Carter’s initiated a strategic shift to modernize its data infrastructure and analytics processes.
To cultivate data literacy across the organization, Carter’s established a Tableau CoE. This initiative focused on improving departmental data literacy, fostering comfort and enthusiasm in using data analytics technology. The CoE provided training and engagement programs, department-focused projects, and one-on-one sessions with data experts. This approach was particularly effective during the COVID-19 pandemic, enabling rapid adaptation to new supply chain and inventory management challenges.
Read the full case study on how Carter’s built a center of enablement with Tableau.
Tableau Case Study 10: UN World Food Programme – Data Literacy Driving Global Food Security
The United Nations World Food Programme (WFP), the world’s largest humanitarian organization, has embarked on a transformative journey to enhance global food security through a robust data-driven approach. Operating in over 120 countries and territories, WFP’s mission to deliver food assistance and build resilience among food-insecure communities is a colossal task, involving the support of over 100 million people annually.
WFP established a Tableau CoE focused on promoting data literacy and analytics usage across the organization. The CoE’s strategy included collaboration, peer leadership, and attracting top talent to drive data literacy. The data literacy program enabled WFP teams to use Tableau dashboards effectively for various projects, including strategic interventions in food-insecure regions.
Tableau Case Study 11: Mobile Tech RX – Revolutionizing Auto Repair with Data Analytics

Mobile Tech RX, a pioneer in the automotive repair software industry, embarked on a transformative journey to revolutionize the traditional, paper-based estimating and invoicing systems in auto repair and body shops. Founded in 2014, the company recognized the inefficiencies in the auto reconditioning industry and aimed to streamline the process with a comprehensive software solution.
The goal was to replace outdated pen-and-paper systems with a modern, digital solution. Many auto shops lacked organized internal reporting sources and struggled to utilize historical data effectively. Mobile Tech RX successfully launched a professional, well-styled software product, significantly enhancing the operational efficiency of auto repair shops. Since its launch, the Mobile Tech RX app has seen substantial growth in its active user base, becoming a leading solution for internal reporting and analytics in the auto repair industry.
Tableau Case Study 12: Texas Rangers – Data-Driven Strategies Enhancing Fan Experience

The Texas Rangers, a renowned American baseball team based in Arlington, Texas, has made significant strides in utilizing data to enhance fan experiences and optimize operations. With a history dating back to 1972 and a large fan base, the organization faced the challenge of modernizing its data strategy to maintain competitive advantage and provide exceptional fan experiences.
By leveraging real-time data, the team optimized gameday operations. For instance, they tracked vehicle entries to manage parking efficiently and monitored gate entries during giveaway nights to enhance fan satisfaction.
Tableau was integrated into the Salesforce Service Cloud to address fan queries more effectively. This allowed for better visualization of frequently asked questions and improved communication with fans.
Read the full case study on how the Texas Rangers’ data strategy hit a home run with fans.
Modernize Your Data & Analytics Insights With Tableau and XeoMatrix
Modernizing your data and analytics insights with Tableau is a strategic move that can significantly transform your data management and analysis capabilities. By centralizing data, enabling real-time insights, scaling seamlessly, promoting collaboration, and prioritizing security and governance, your organization can gain a competitive edge and drive innovation in the dynamic digital landscape.
XeoMatrix offers expert assistance in modernizing your Data & Analytics infrastructure. Our team of skilled professionals can guide you through the implementation of a modern data stack, leveraging powerful tools like Tableau to unlock the true potential of your data-driven insights. Contact us today to embark on your journey toward data-driven success.
About XeoMatrix
XeoMatrix provides consulting services for data and analytics to assist companies in comprehending their data for informed business decisions. Our established methodology streamlines the development process, allowing our clients to concentrate on analyzing their business, enhancing data visualization, and ultimately boosting ROI. To learn more about our business intelligence and data warehousing solutions, don’t hesitate to contact us today.