Tableau Advanced Visualizations
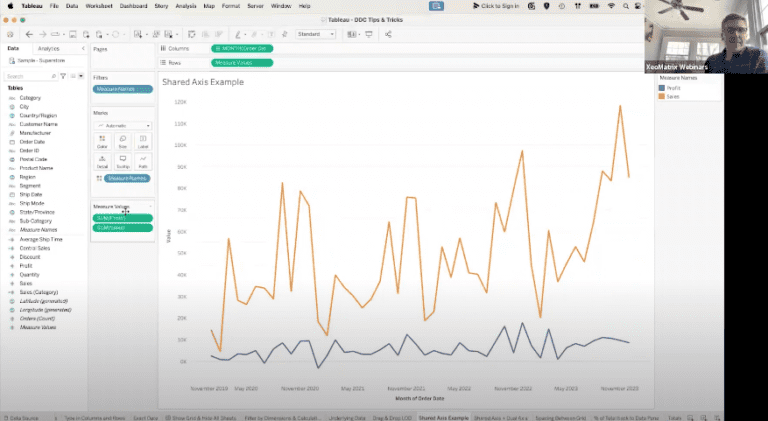
Explore advanced Tableau techniques in this session, including sparklines, dual axis charts, donut charts, and upcoming Viz Extensions for enhanced data visualization and interactivity.

Explore advanced Tableau techniques in this session, including sparklines, dual axis charts, donut charts, and upcoming Viz Extensions for enhanced data visualization and interactivity.

Take your Tableau dashboards to the next level with our upcoming meetup on “Advanced Formatting for Tableau Dashboards.” This session is designed for Tableau users who want to enhance their dashboards’ visual appeal and usability.
Unlock the full potential of Tableau with expert tips: streamline workflows, enhance data analysis, and create dynamic dashboards for impactful storytelling.
Explore ’12 Tableau Case Studies to Inspire You in 2024′ for insights on how Tableau transforms data management and analytics in various sectors, enhancing decision-making and efficiency.
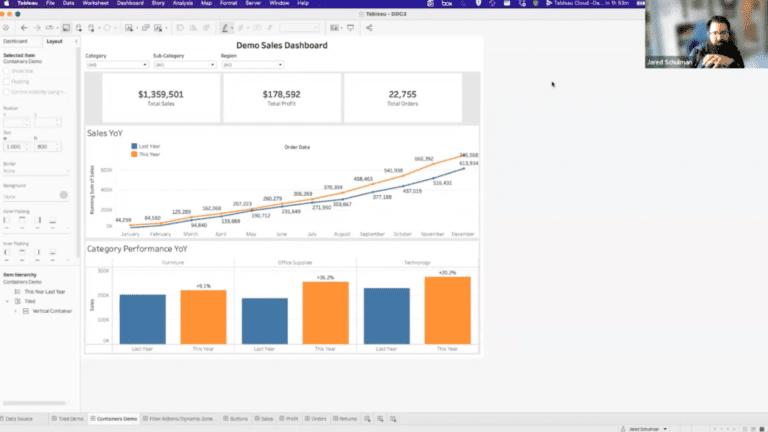
Explore advanced Tableau dashboarding techniques, including dynamic filters, containers, and interactive elements for enhanced data visualization.
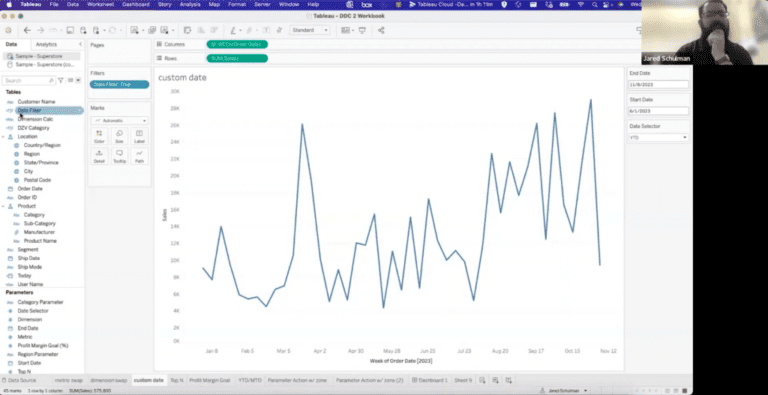
Session on Mastering Tableau Parameters, where Jared showed how to harness the power of Tableau parameters to create interactive and insightful dashboards.
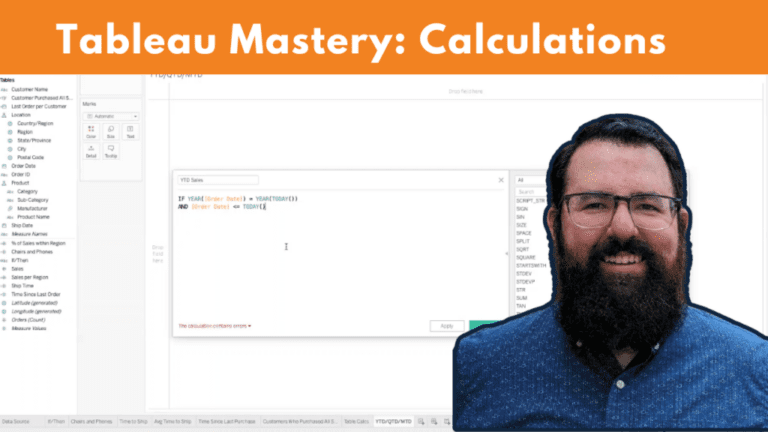
In this session, attendees delved into the intricacies of Tableau calculations, exploring topics such as formulas, table counts, IF-THEN statements, date calculations, and level of detail expressions, before wrapping up with a discussion on year-to-date, month-to-date, and quarter-to-date formulas, followed by an engaging Q&A session.

In Tableau 2023.1, a new feature allows you to have dynamic axis titles for fields that reference parameters. This means that the axis title can automatically update based on the selected parameter value, providing more flexibility in your visualizations.
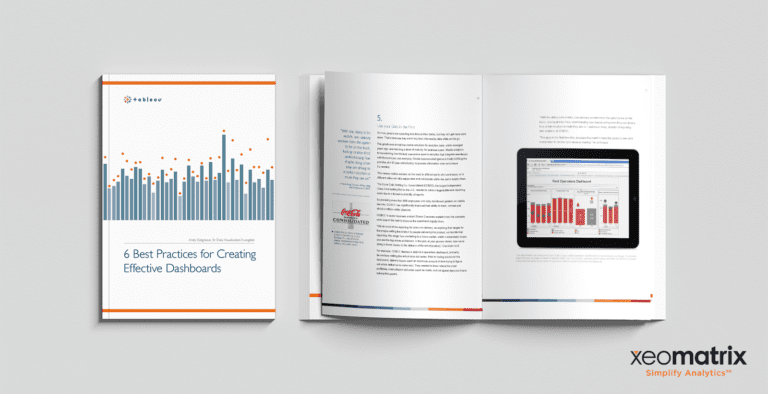
This whitepaper, written by Andy Cotgreave, is a roundup of the top 6 practices you have to keep in your toolbox to create effective dashboards using the data visualization tool Tableau.