MFA authenticator app for tableau cloud

Set up an MFA Authenticator App for Tableau Cloud

The Tableau Cloud environment will begin enforcing multi-factor authentication for all site admins. Set up an MFA authenticator app before being able to access your Tableau Cloud site.

Tableau Security Notifications

Tableau Security Notification: Protect Your Information

Salesforce Security discovered that, due to a coding error, machines installed with specific versions of Tableau Bridge Client are logging database secrets.

How To Visualize Year-To-Date Calculations in Tableau

How to do year-to-date, month-to-date, or quarter-to-date calculations for any metrics on your Tableau Dashboard.

mobile device-specific dashboard in tableau

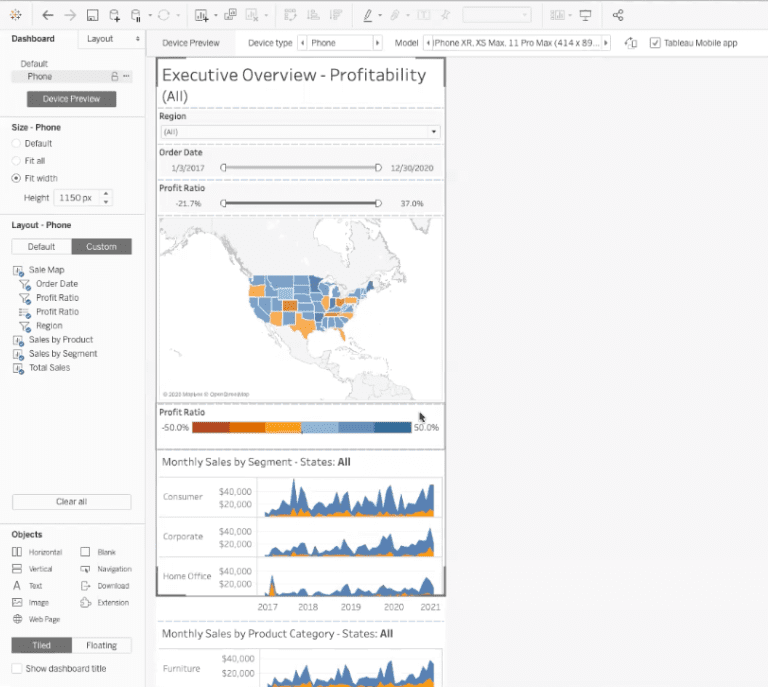
Device-Specific Dashboards In Tableau

Tableau makes it easy for users to create device-specific dashboards in Tableau, and provides a wide range of device and screen sizes options. Users viewing published content on Tableau Online or Tableau Server will see a dashboard automatically adjusted to fit whichever device is being used. This feature was designed to give users the same…
shared axis dashboard with green profit data field and blue sales data field

Dual-Axis vs. Shared Axis In Tableau

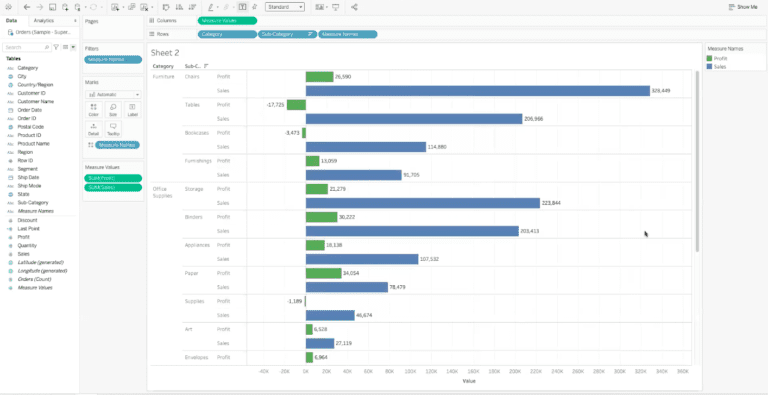
Tableau allows users to create a wide variety of visualizations within a dashboard. When you want to understand the relationship between two measure values in Tableau, you can use a dual-axis or shared axis view. Both visualizations show relationships, but they do so in different ways depending on the measure values you need to understand.…
tableau tips and tricks

Click and Drag to Create Duplicates in Tableau

We at XeoMatrix have gathered a few tips & tricks that can make your Tableau development experience even more efficient. Today's topic is: Click and Drag to Create Duplicates. To easily create a duplicate image, icon, chart, or graph in your Tableau worksheet, you can use the control, click, and drag shortcut. We've created an…
tableau dashboard displaying donut chart

How to Make Donut Charts In Tableau

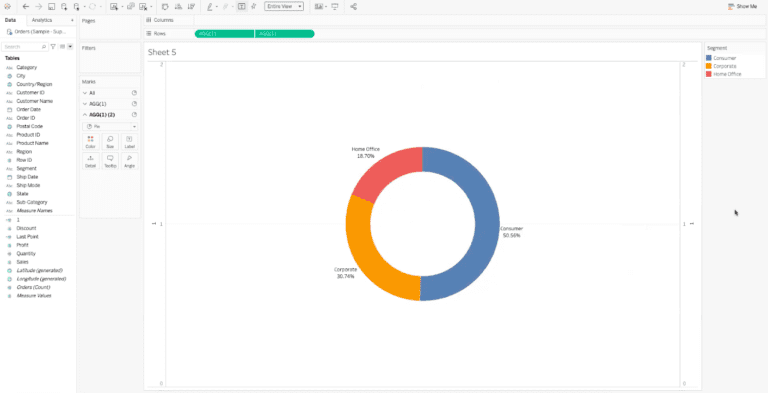
Donut charts have begun to replace Pie charts in data visualization. While they provide a similar level of detail or
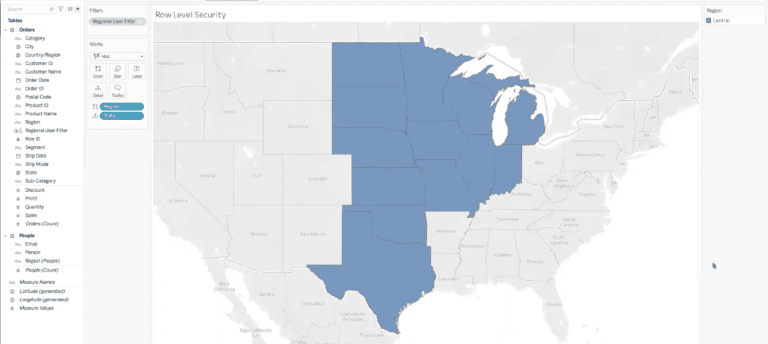
 insight into data, the Donut chart has become best practice. To learn how to make donut charts in Tableau, follow our step-by-step tutorial below. What Is a Donut Chart? A donut chart is very similar…
tableau tips and tricks

Add Data from an Online Source in Tableau

We at XeoMatrix have gathered a few tips & tricks that can make your Tableau development experience even more efficient. Today's topic is: Add Data from an Online Source. If you want to add data into your Tableau worksheet from an online source, you can easily copy and paste it. Let's say, for example, that…
example crosstabular dashboard view in tableau

How to Remove Grouping from Crosstabs In Tableau

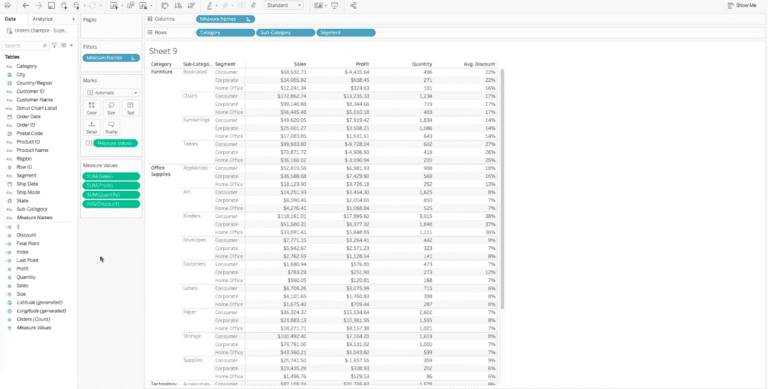
Tableau creates crosstab groups in order to help us quickly understand data. However, these groupings are not usually the best way to present visual data to an end-user. In this article, we will teach you how to remove grouping from crosstabs in Tableau. What Are Crosstabs in Tableau? A crosstabular view in Tableau shows detailed…
tableau tips and tricks

Quickly Add a Flat File to Tableau

We at XeoMatrix have gathered a few tips & tricks that can make your Tableau development experience even more efficient. Today's topic is: Quickly Add a Flat File to Tableau. Tableau is able to quickly load flat files with a simple click and drag. Below, we have an empty example worksheet and an example flat…
Subscribe

Join our list to receive data analytics tips and tricks in your inbox.

  • This field is for validation purposes and should be left unchanged.

Need help simplifying your data analytics?

From Tableau training and support to custom dashboard design and embedded analytics, find out how XeoMatrix can help you optimize your business intelligence and data strategy.

Contact Us To Get Started