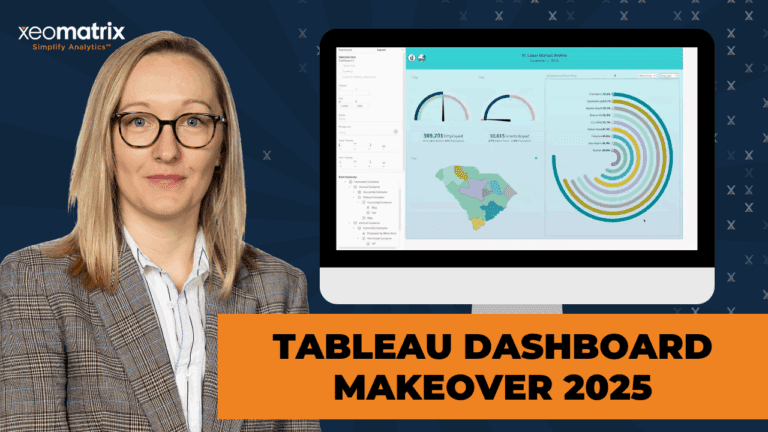
Tableau Dashboard Makeover 2025
Explore the transformation of a Tableau dashboard with modern features and best practices, showcasing actionable strategies to elevate data visualization and interactivity.

Explore the transformation of a Tableau dashboard with modern features and best practices, showcasing actionable strategies to elevate data visualization and interactivity.

About the Event Today, we are in the agentic era. Agentforce is transforming business with a limitless workforce, and together
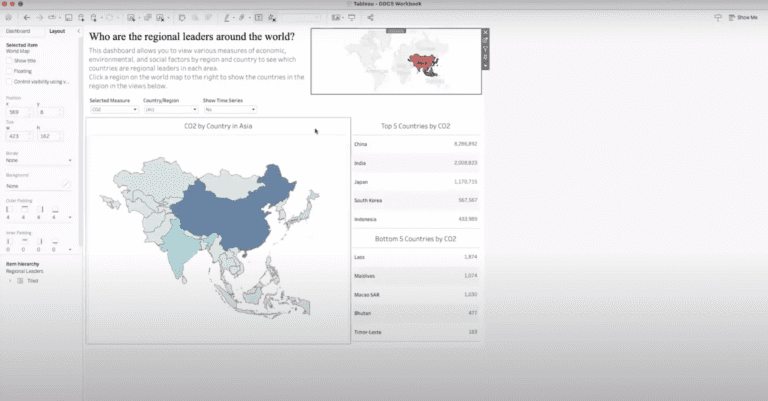
About the Event Elevate your Tableau skills with advanced mapping techniques in this data-driven community meetup! Explore new features in
About the Event Start the new year with a fresh perspective on your Tableau dashboards! In this meetup, we’ll revisit
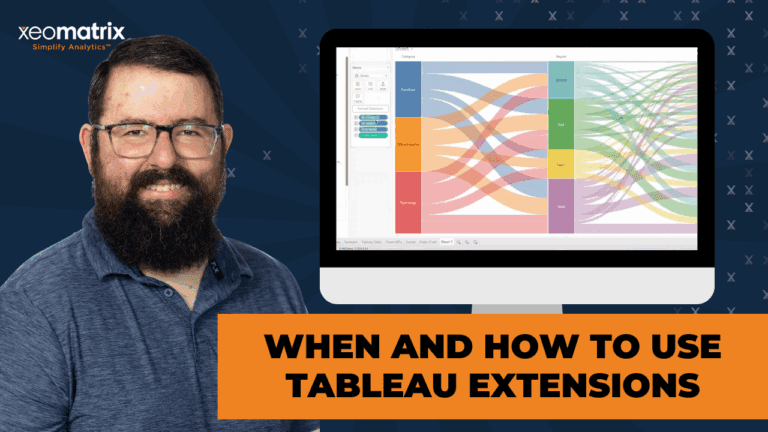
Discover how Tableau Extensions like Sankey diagrams, Sunburst charts, and Tableau Tables simplify advanced visualizations and customizations, unlocking powerful insights with ease.
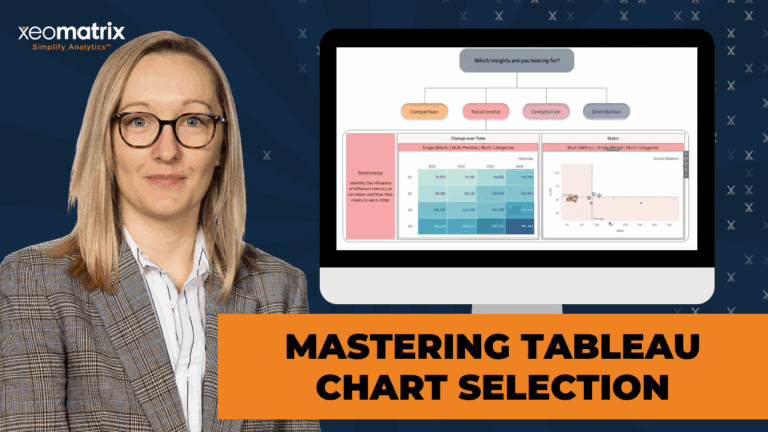
Learn how to choose and build the right Tableau visuals to answer analytical questions effectively. Explore comparison, relationship, composition, and distribution chart types in detail.
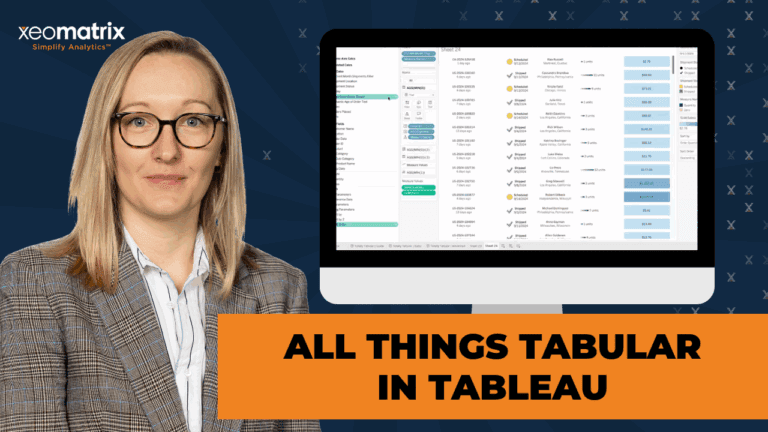
The session, titled All Things Tabular in Tableau, provided a detailed walkthrough of creating advanced tables and tabular visualizations in Tableau. Lauren Cristaldi led the live demonstration, highlighting best practices for transforming basic tables into visually engaging and functional reports.
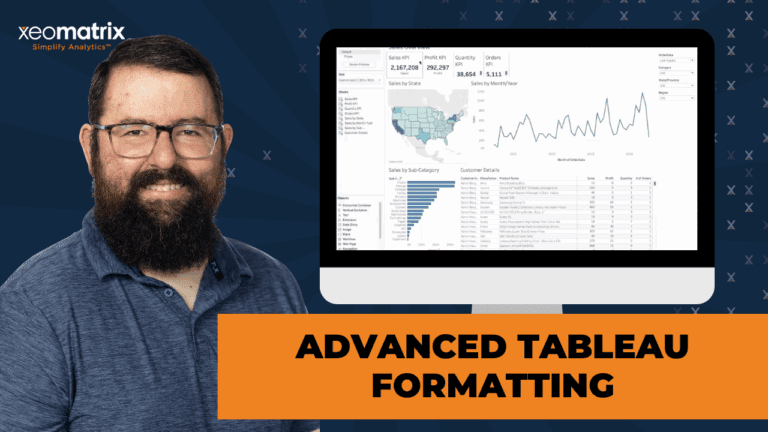
Take your Tableau dashboards to the next level with our recorded webinar on “Advanced Formatting for Tableau Dashboards.” This session is designed for Tableau users who want to enhance their dashboards’ visual appeal and usability.
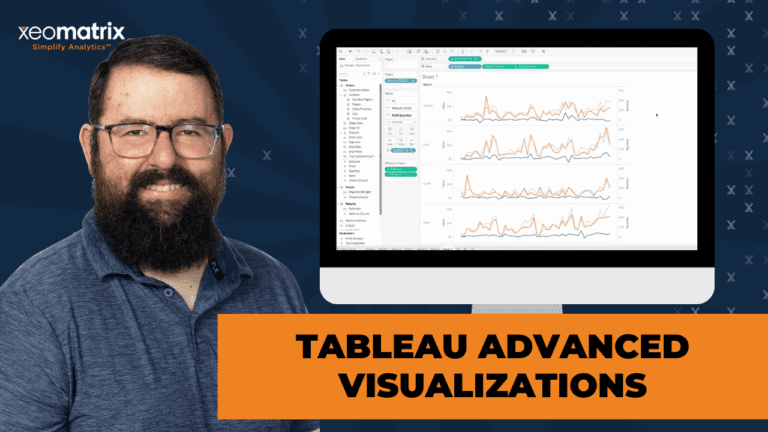
Explore advanced Tableau techniques in this session, including sparklines, dual axis charts, donut charts, and upcoming Viz Extensions for enhanced data visualization and interactivity.
Matillion’s Data Productivity Cloud streamlines data integration, enhancing quality and speed. The platform supports AI, simplifies pipeline development, and offers flexible deployment options.
Tableau Pulse leverages AI for personalized, smart insights in Tableau Cloud. It requires published data sources and offers mobile-friendly, customizable metrics for enhanced data accessibility.
This webinar explores how organizations leverage Tableau to deliver robust embedded analytics to their clientele and partners.
This session covered multiple use cases for Tableau’s Dynamic Zone Visibility functionality, including sheet swapping, showing and hiding legends and filters, and drill-down data exploration.
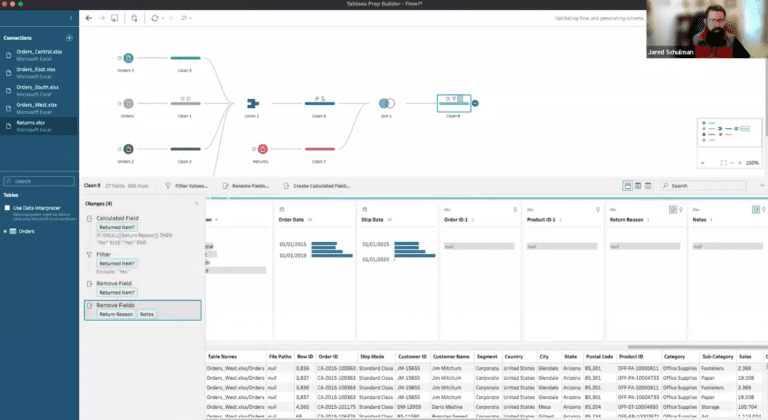
Master data prep with Tableau Prep: Simplify unions, joins, & pivots for enhanced data insights. Transform complex tasks efficiently.
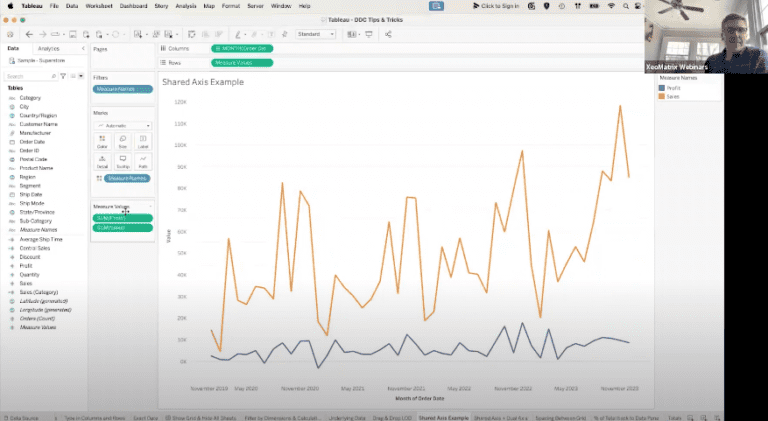
Unlock the full potential of Tableau with expert tips: streamline workflows, enhance data analysis, and create dynamic dashboards for impactful storytelling.
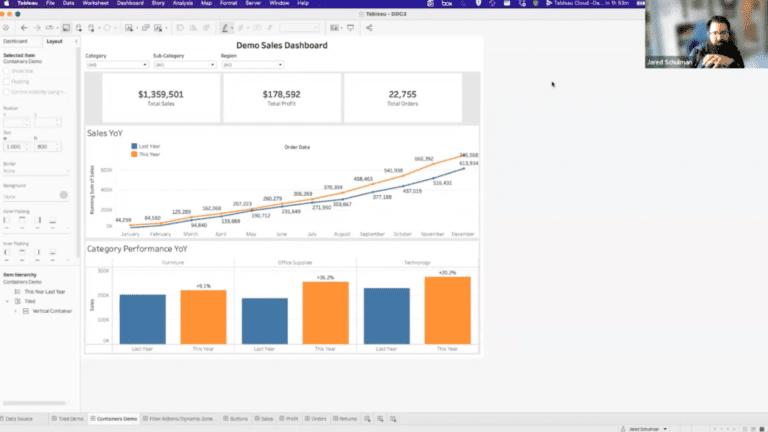
Explore advanced Tableau dashboarding techniques, including dynamic filters, containers, and interactive elements for enhanced data visualization.
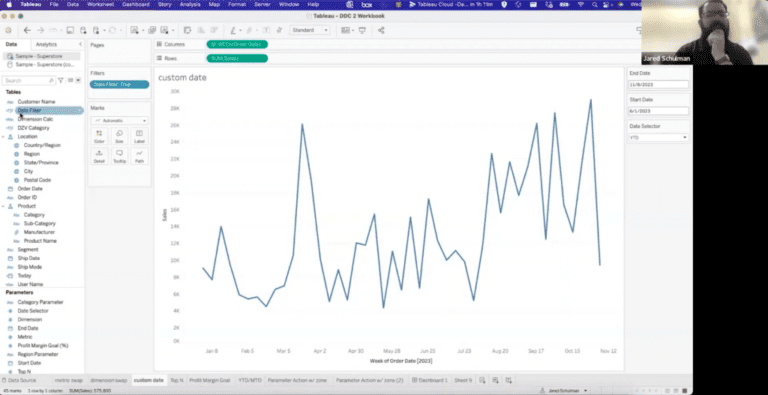
Session on Mastering Tableau Parameters, where Jared showed how to harness the power of Tableau parameters to create interactive and insightful dashboards.
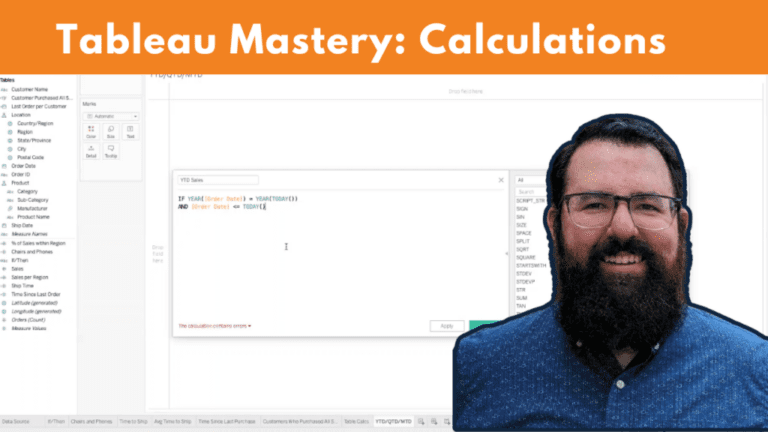
In this session, attendees delved into the intricacies of Tableau calculations, exploring topics such as formulas, table counts, IF-THEN statements, date calculations, and level of detail expressions, before wrapping up with a discussion on year-to-date, month-to-date, and quarter-to-date formulas, followed by an engaging Q&A session.