12 Tableau Case Studies to Inspire You in 2024
Explore ’12 Tableau Case Studies to Inspire You in 2024′ for insights on how Tableau transforms data management and analytics in various sectors, enhancing decision-making and efficiency.

Explore ’12 Tableau Case Studies to Inspire You in 2024′ for insights on how Tableau transforms data management and analytics in various sectors, enhancing decision-making and efficiency.
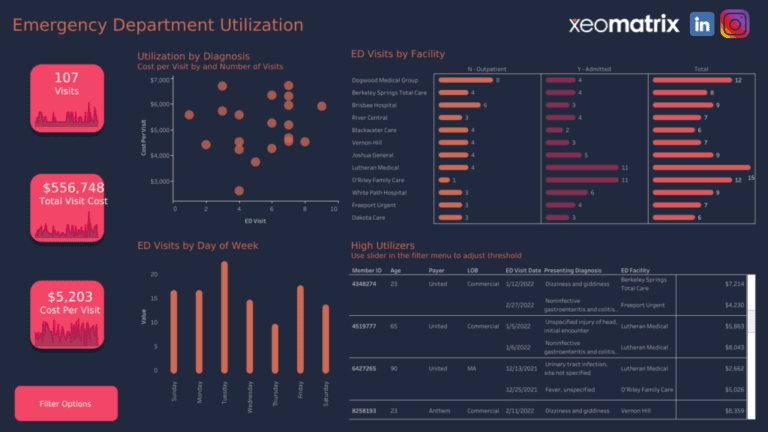
Explore advanced Tableau dashboarding techniques, including dynamic filters, containers, and interactive elements for enhanced data visualization.
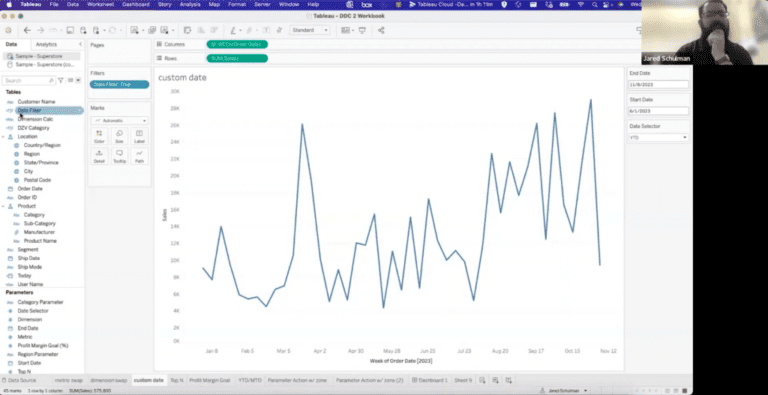
Session on Mastering Tableau Parameters, where Jared showed how to harness the power of Tableau parameters to create interactive and insightful dashboards.
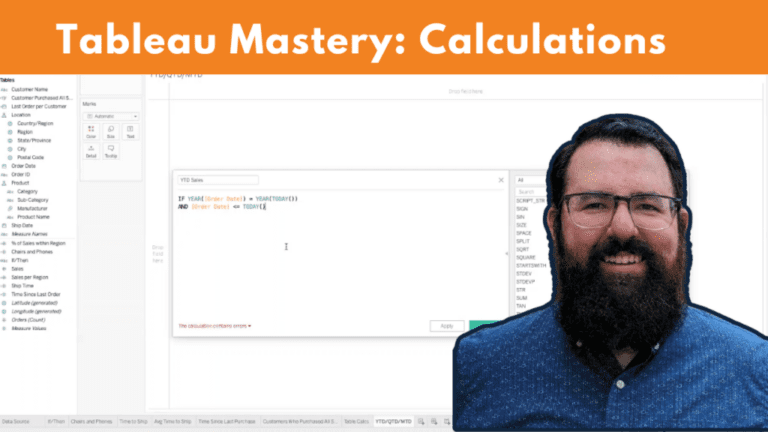
In this session, attendees delved into the intricacies of Tableau calculations, exploring topics such as formulas, table counts, IF-THEN statements, date calculations, and level of detail expressions, before wrapping up with a discussion on year-to-date, month-to-date, and quarter-to-date formulas, followed by an engaging Q&A session.

MicroStrategy and Tableau, how they serve the modern data movement, and which BI software is best for your organization.
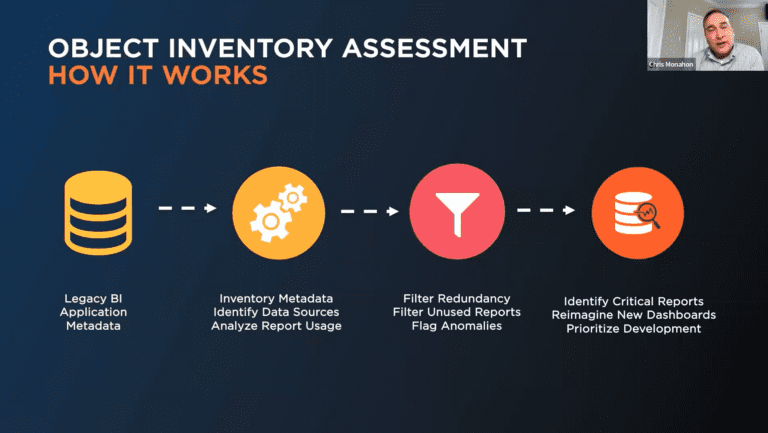
Learn about the challenges the consumer and retail goods organizations face when they have outdated legacy data and analytics solutions.
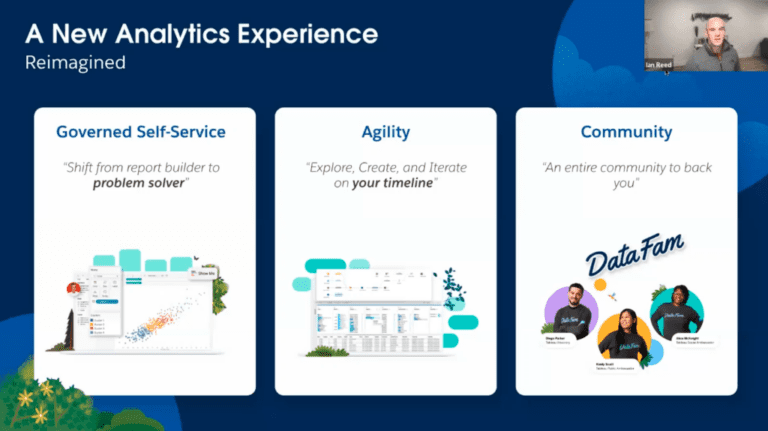
Learn perspectives on the challenges organizations face when they have outdated legacy Data & Analytics solutions and how moving to a modern BI platform can take your organization to the next level.

In Tableau 2023.1, a new feature allows you to have dynamic axis titles for fields that reference parameters. This means that the axis title can automatically update based on the selected parameter value, providing more flexibility in your visualizations.
Learn how we successfully leveraged a tried and true process to migrate Tableau to the Cloud for multiple clients.
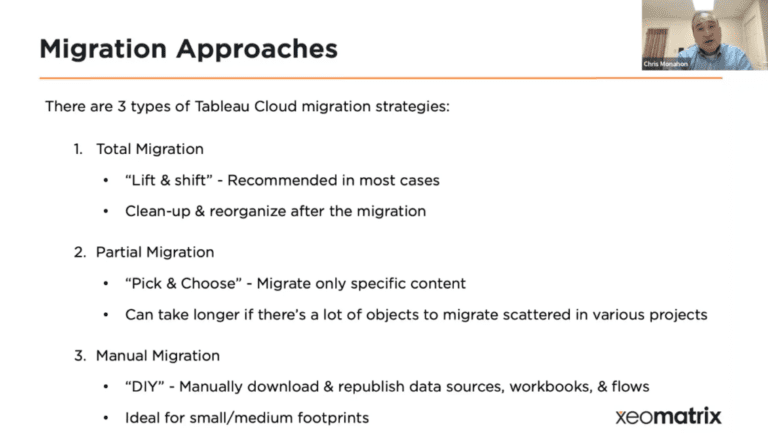
Are you ready to modernize your stagnant legacy analytics platform? Start planning for your migration to Tableau.
Data Visualization Evaluation Guide: How to Choose the Right Modern BI & Analytics Platform whitepaper provides a comprehensive framework for evaluating and selecting the right platform.

Tableau is all about empowering people to be more data-driven. While Tableau is a powerful and user-friendly platform for data exploration and analysis, there are still many scenarios where organizations may benefit from working with a Tableau consultant.
Learn how your organization can get more out Tableau by understanding Tableau’s best practices for better deployment, training, and adoption.
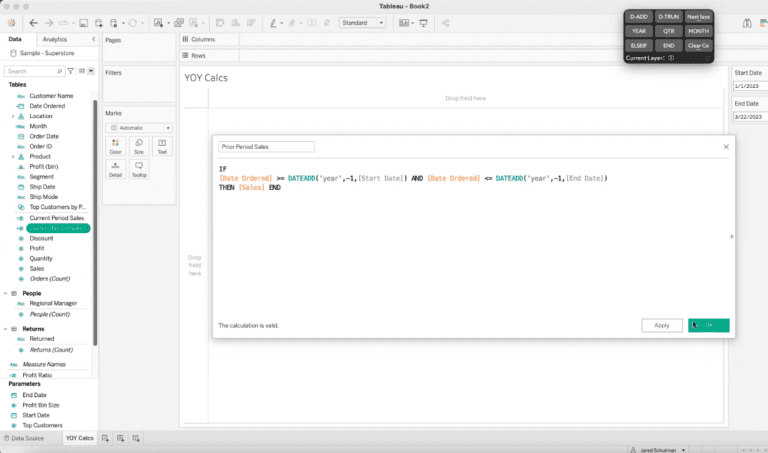
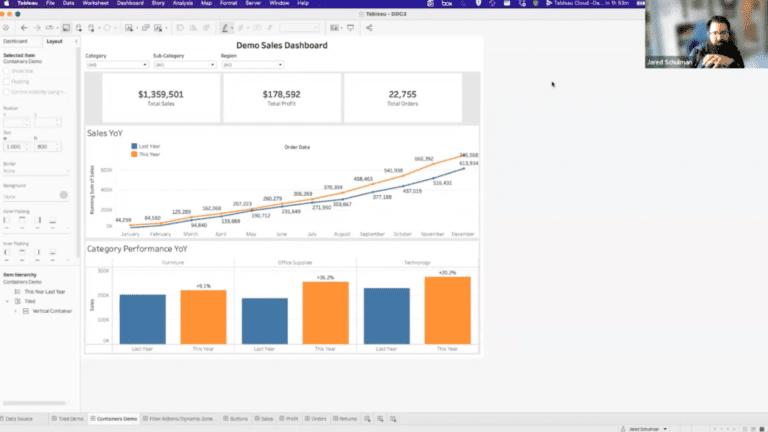
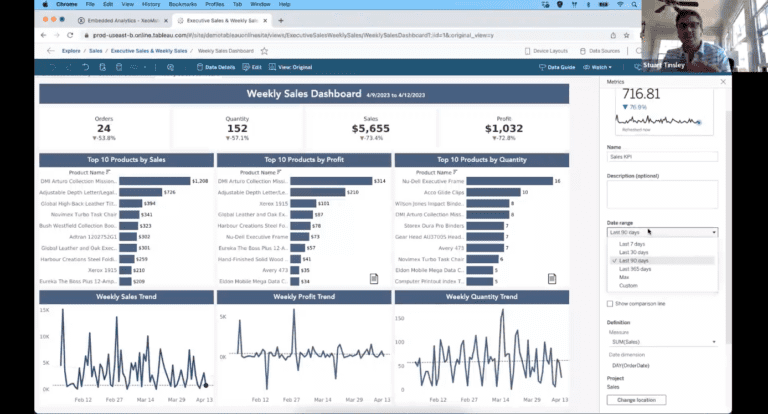
A year-over-year analysis is essential for businesses to track their performance and identify trends. Businesses can gain insights into their
The Developing a Data Visualization Strategy with Tableau Blueprint whitepaper guides you on how to create elegant data dashboards that are intuitive, automated, and exciting to make better business decisions.
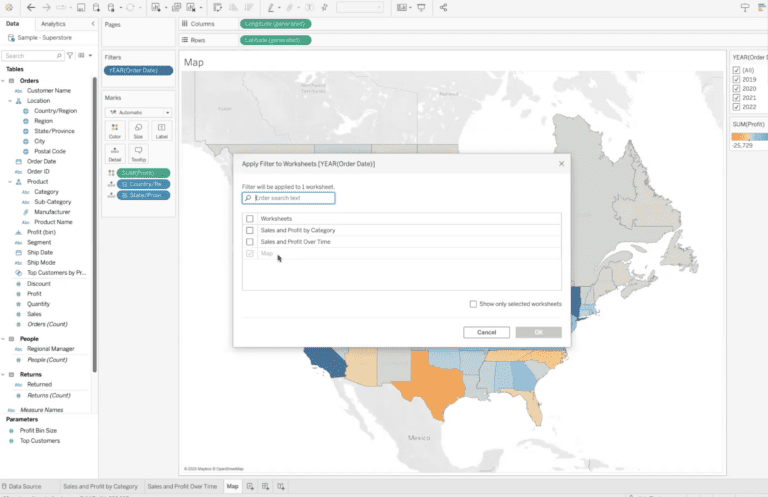
Step by step guide on how to apply a filter to multiple sheets in Tableau.
This article covers the objectives of a proof of concept engagement that you should consider while evaluating a migration from MicroStrategy to Tableau.
Upgrade your data visualization and analytics tools by migrating from Tableau Server to Tableau Cloud.